

The benefits of getting around Arizona on your bicycle are impressively numerous, from cycling events like El Tour de Tucson to year-round riding conditions that draw thousands of new cyclists to the state each year. However, recent US bicycle accident statistics prove that the Grand Canyon State has palpable dangers to keep away from, too.
Hundreds of traumatic and even fatal bicycle accidents happen on the roads of Arizona on a yearly basis. Understanding where, when, and why these crashes occur can help improve local infrastructure and protect riders across the state.
- Key Arizona Bicycle Accident Statistics
- How Safe Is Arizona for Bicyclists?
- Bicycle Accident Trends in Arizona
- What Causes Most Bicycle Accidents in Arizona?
- Bicycle Accident Statistics by County in Arizona
- Bicycle Accident Statistics by Gender in Arizona
- Bicycle Accident Statistics by Age in Arizona
- Bicycle Accident Statistics by Injury Severity in Arizona
- Bicycle Accident Statistics by Area Type
- Bicycle Accident Statistics by Location Type
- Bicycle Accident Statistics by Time of Day
- Bicycle Accident Statistics by Day of the Week
- Bicycle Accident Statistics by Day of the Week
- Bicycle Accident Statistics by Month
- Bicycle Accident Statistics by Weather Conditions in Arizona
- Bicycle Accident Statistics by Weather Conditions in Arizona
- Bicycle Accident Stats by Alcohol and Drug Use
- Bicycle Accident Stats by Alcohol and Drug Use
- E-Bike Crash Statistics in Arizona
- Arizona vs. National Bicycle Accident Comparison
- First Steps to Take If You’ve Been in a Cycling Accident in Arizona
- Conclusion
- Get a FREE case evaluation today
Key Arizona Bicycle Accident Statistics
In 2024, the Arizona Department of Transportation (ADOT) Motor Vehicle Crash Facts report recorded 1,379 bicycle crashes statewide, the highest figure in five years and a 21% increase over 2023. Approximately 44 cyclists lost their lives, and over 1,300 sustained injuries, confirming that bicycle-involved crashes in Arizona are trending upward even as total motor vehicle collisions decline.
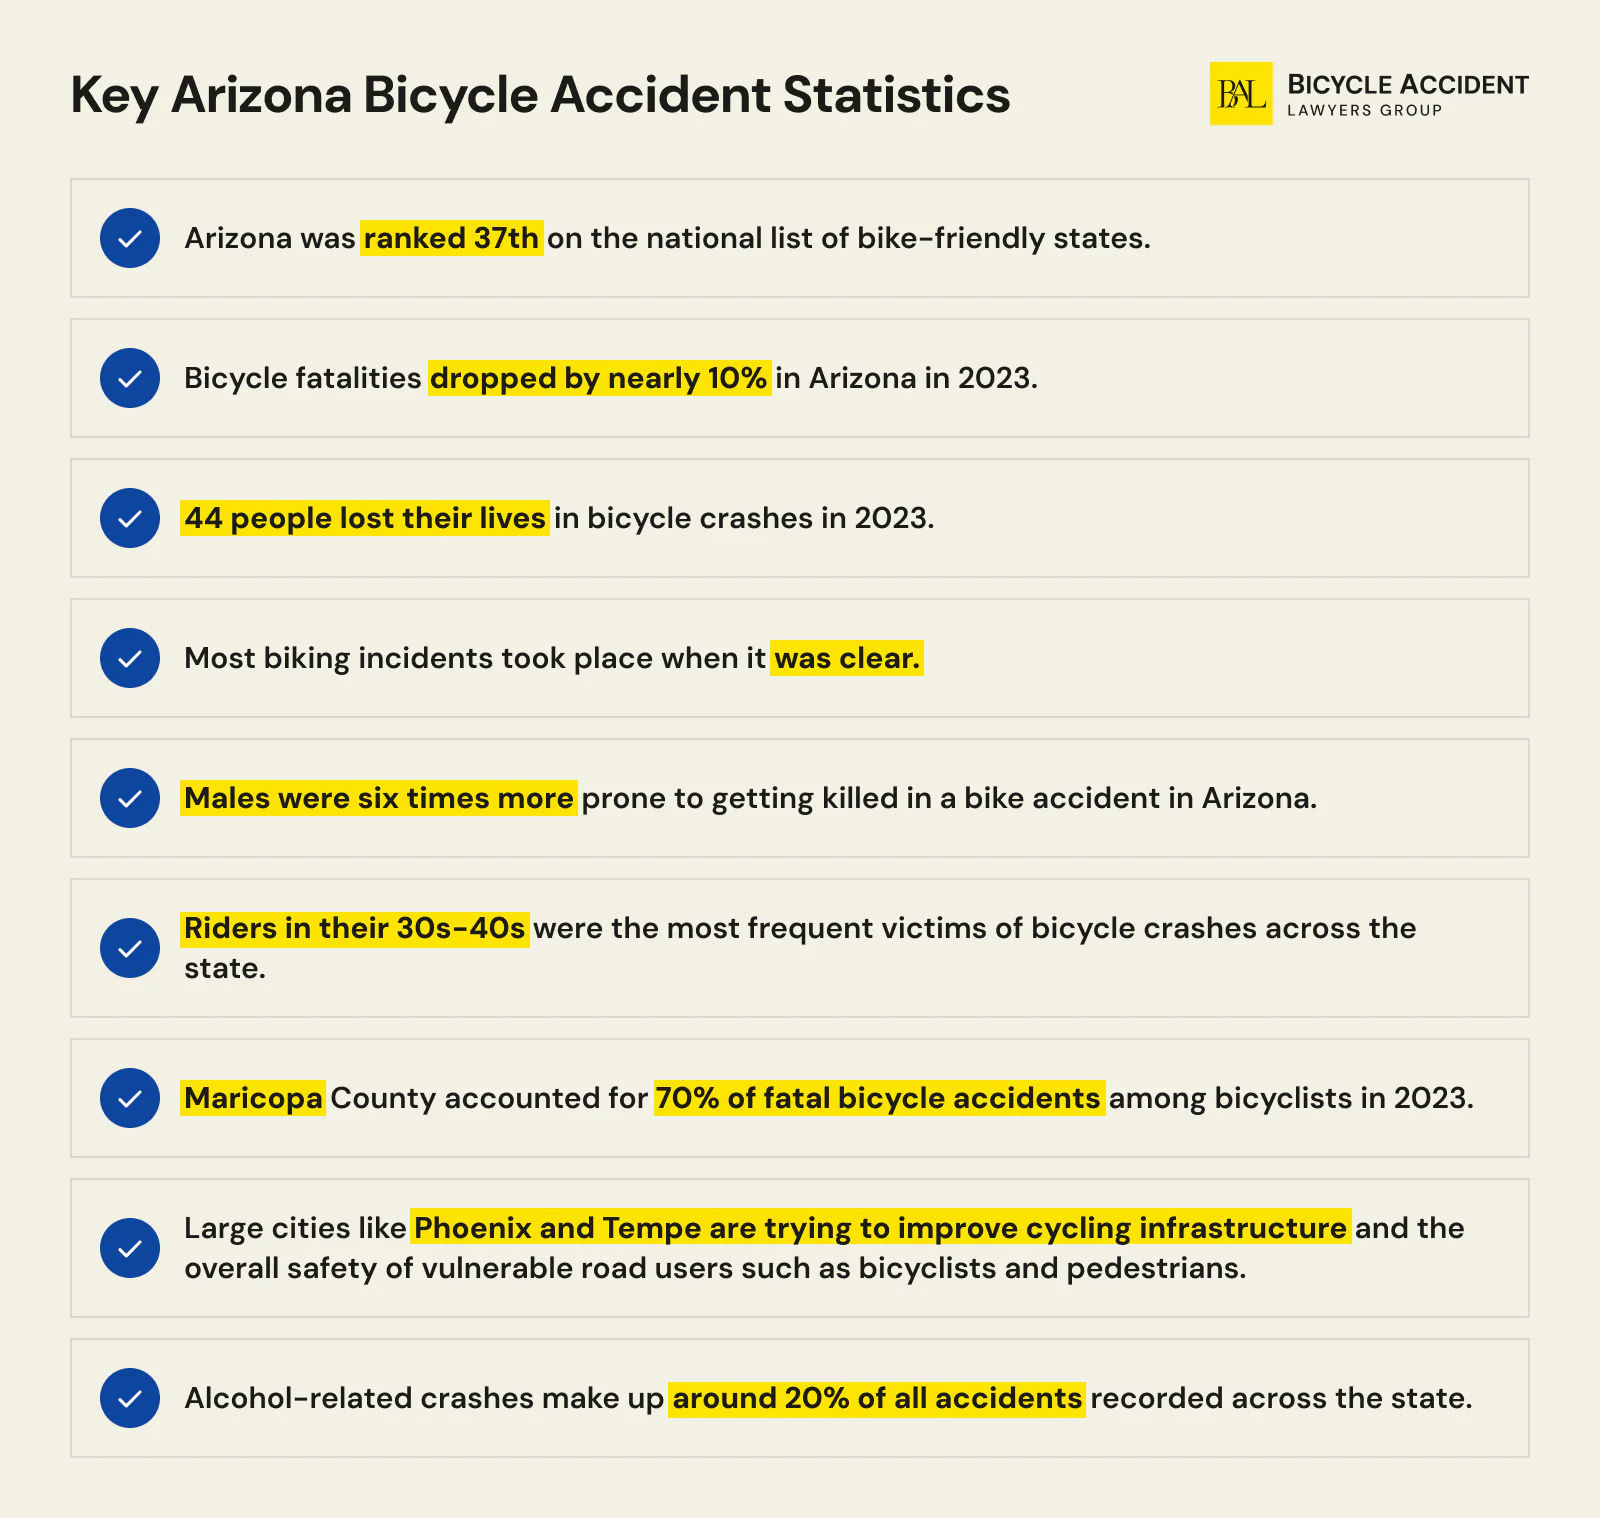
- Approximately 44 people lost their lives in bicycle crashes in 2024, holding steady from 2023.
- Arizona was ranked 37th on the national list of bike-friendly states.
- Most biking incidents took place when it was clear.
- Males accounted for 86% of cyclist fatalities, more than six times the number of female cyclist deaths.
- Riders aged 25–44 sustained the most injuries, while those aged 55–74 had the highest fatality rate.
- Maricopa County accounted for approximately 70% of fatal bicycle accidents among bicyclists.
- Driver error contributed to 52% of all bicycle-involved collisions, according to ADOT crash data.
- E-bike-involved crashes accounted for approximately 12% of bicycle incidents statewide.
- Large cities like Phoenix and Tempe are trying to improve cycling infrastructure and the overall safety of vulnerable road users such as bicyclists and pedestrians.
- Alcohol-related crashes make up around 20% of all accidents recorded across the state.
How Safe Is Arizona for Bicyclists?
Arizona’s safety record for cyclists is mixed. While investments in cycling infrastructure are increasing, several significant risk factors persist:
-
Alarming crash rate
Alarming crash rate Although the general accident rate dropped by almost 4.5% in 2024, thousands of bike riders sustained serious injuries on the roads of Arizona. More tellingly, bicycle crashes climbed to a five-year high of 1,379 even as total motor vehicle crashes decreased by 1.74%, suggesting that cyclist exposure risk is growing disproportionately to general traffic volume.
-
Multiple risk zones
Multiple risk zones The density of the population and inconsistent infrastructure in urban areas of the state make them high-risk zones for cyclists. Recent Arizona bicycle laws promoted the implementation of a 20-miles-per-hour speed limit in such locations but provided no legal authority or guidance as to how to succeed with the regulation
-
Helmet use
Helmet use Arizona helmet laws are anything but restrictive. In Tucson, Sierra Vista, Yuma, Flagstaff, and Pima County, all bicyclists aged 18 and under must wear a helmet while riding a bicycle. Cyclists in other communities decide whether to wear one, which may be a factor in Arizona’s bike deaths. A 2023 University of Arizona study found that proper helmet use reduces the risk of head injury by approximately 70%, yet no statewide mandate exists for adult riders.
-
Motorist awareness
Motorist awareness Instances of distracted driving, aggressive passing, and failure to yield to bicyclists across the state are quite frequent. The lack of driver education that instructs motorists on how to behave when sharing the road with a cyclist and their legal responsibilities may be among the common triggers of bicycle accidents in Arizona
Arizona’s Cycling Safety Ranking in Context
The League of American Bicyclists ranked Arizona 37th on its Bicycle Friendly State Report Card in 2024. The state’s per-capita bicyclist fatality rate is approximately 2.62 deaths per 1,000 bicycle commuters, based on NHTSA FARS data and Census Bureau bicycle commuter figures. This places Arizona among the more dangerous states for cyclists nationwide. States that have invested heavily in protected bicycle infrastructure and adopted Safe System or Vision Zero strategies tend to record measurably lower cyclist fatality rates, offering a benchmark for Arizona’s ongoing improvement efforts.
On the infrastructure front, several Arizona municipalities have begun incorporating Complete Streets design principles and elements of the NACTO Urban Bikeway Design Guide and the AASHTO Guide for the Development of Bicycle Facilities into their transportation plans. Phoenix’s Transportation 2050 plan includes adding over 1,000 miles of bike lanes, while Tempe recently secured a $25 million federal RAISE grant through the Bipartisan Infrastructure Law for a bicycle and pedestrian bridge over the Rio Salado. These investments signal a commitment to reducing crash risk, though the 2024 data shows that the pace of infrastructure development has not yet caught up with the pace of crash growth.
Bicycle Accident Trends in Arizona
ADOT data spanning 2014 to 2024 reveals the following long-term trends:
To grasp a larger picture, we’ve analyzed bicycle accidents over a decade in Arizona. Based on the gathered numbers, we can assume the following:
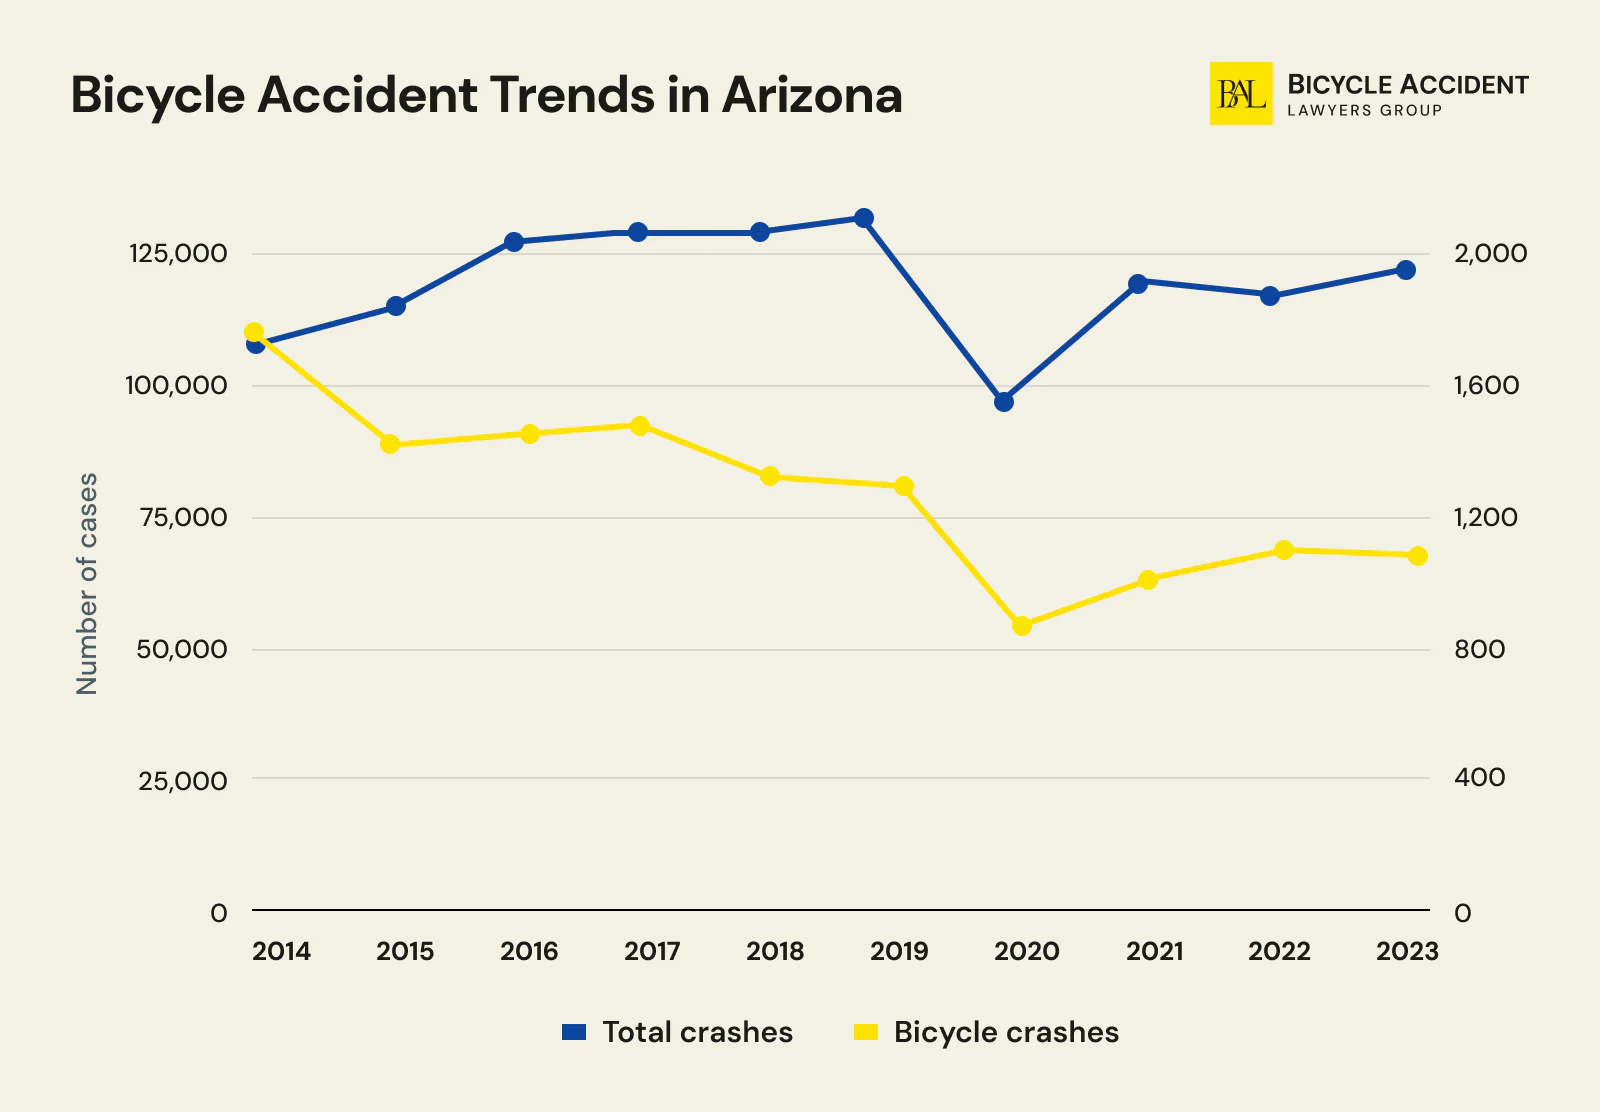
- The overall percentage of bicycle crashes, as compared to total crashes, showed a steady decrease from 2014 to 2021.
- The number of bike accidents dropped from 2014 to 2023, but the number of bicycle fatalities spiked.
- 2020 saw the fewest bicycle accidents within the decade.
- There was a minor drop in bicycle accidents in 2023, but fatality rates almost doubled compared to 2014.
- In 2024, bicycle crashes surged to 1,379, the highest figure since 2015 and a sharp reversal of the prior downward trend.
The decade from 2014 to 2024 reveals a complex pattern. While the raw number of bicycle crashes declined from a peak of 1,742 in 2014 through much of the following years, fatalities nearly doubled over the same period, rising from 28 to approximately 44. This divergence between crash frequency and crash severity suggests that when bicycle accidents do occur in Arizona, they are becoming more lethal, likely due to higher vehicle speeds, heavier vehicles on the road, and gaps in protected cycling infrastructure.
All crash figures in this report are derived from Arizona Traffic Crash Reports filed by law enforcement agencies statewide and compiled by ADOT in its annual Motor Vehicle Crash Facts publication. Because these statistics rely on police-reported crashes, incidents that are not reported to law enforcement are not captured in the data. This includes many minor collisions and single-bicycle crashes.
| Year | Total Crashes | Bicycle Crashes | % | Bicycle fatalities | Cyclists Injured |
| 2014 | 109,554 | 1,742 | 1.59% | 28 | 1,459 |
| 2015 | 116,609 | 1,434 | 1.23% | 29 | 1,266 |
| 2016 | 126,987 | 1,479 | 1.16% | 31 | 1,335 |
| 2017 | 127,064 | 1,490 | 1.17% | 32 | 1,366 |
| 2018 | 127,056 | 1,279 | 1.01% | 24 | 1,178 |
| 2019 | 129,750 | 1,275 | 0.98% | 30 | 1,245 |
| 2020 | 98,778 | 830 | 0.84% | 33 | 797 |
| 2021 | 121,345 | 1,027 | 0.85% | 45 | 982 |
| 2022 | 119,991 | 1,159 | 0.97% | 48 | 1,112 |
| 2023 | 122,247 | 1,139 | 0.93% | 44 | 1,096 |
Are Bicycle Accidents Increasing in Arizona?
Yes. Despite a decline in total motor vehicle crashes, bicycle-involved crashes in Arizona reached a five-year high of 1,379 in 2024, a 21% increase from 1,139 in 2023. This upward movement is significant because it reverses the general decrease observed between 2017 (1,490 crashes) and 2020 (830 crashes, reduced by pandemic conditions). The bicycle crash rate as a percentage of all crashes rose from 0.93% in 2023 to 1.14% in 2024. More critically, while total crashes decreased by 1.74%, bicycle crashes increased, indicating that cyclist exposure risk is outpacing general traffic safety improvements.
One methodological challenge in interpreting these trends is the denominator problem: raw crash counts do not account for changes in cycling volume or exposure. Arizona currently lacks a comprehensive bicycle count network, making it difficult to determine whether the crash rate per cyclist trip or per mile ridden has actually increased, or whether more crashes simply reflect more people cycling on Arizona roads. Until statewide bicycle volume data becomes available through automated count stations or travel surveys, year-over-year crash comparisons should be understood as reflecting total incidents rather than per-rider risk.
“It’s encouraging to see fewer fatalities on Arizona’s roadways, but the numbers are still too high and affecting too many people,” ADOT Director Jennifer Toth noted in the 2024 report. The Governor’s Office of Highway Safety echoed the concern, with Director Jesse Torrez stating: “These aren’t just numbers; they’re individuals, families forever altered.”
What Causes Most Bicycle Accidents in Arizona?
According to ADOT crash data, driver error is the leading cause of bicycle accidents in Arizona, contributing to 52% of all bicycle-involved collisions. Distracted driving, failure to yield the right of way, and excessive speed are the three most frequently cited behavioral factors in the state’s annual crash reports.
Driver Behavior as the Primary Cause
The data paints a clear picture: most bicycle accidents in Arizona originate from the actions of motor vehicle operators rather than cyclists themselves. The breakdown of leading causes reported by ADOT includes:
| Cause Factor | % of Bicycle Crashes | Source |
|---|---|---|
| Driver error (all types) | 52% | ADOT 2023 Crash Facts |
| Distracted driving (cell phone use, in-vehicle distractions) | 28% | ADOT 2023 Crash Facts |
| Failure to yield right of way | 19% | ADOT 2023 Crash Facts |
| Speeding / excessive speed | 15% | ADOT 2023 Crash Facts |
These percentages can overlap, as a single crash may involve both distraction and failure to yield. They nonetheless highlight that the majority of bicycle-involved collisions are attributable to preventable driver behavior.
Common Crash Types
When a motor vehicle and a bicycle collide, the circumstances tend to follow recognizable patterns. The most frequently observed crash types in Arizona include:
- Right-hook crashes — A driver turns right at an intersection directly across the path of a cyclist traveling straight through. This is one of the most common and dangerous crash configurations at urban intersections.
- Overtaking crashes — A motorist passes a cyclist too closely, violating Arizona’s safe passing law that requires a minimum of three feet of clearance.
- Dooring incidents — A driver or passenger opens a car door into the path of an approaching cyclist, often in areas where on-street parking sits adjacent to travel lanes.
- Hit-and-run collisions — The driver flees the scene after striking a cyclist. These incidents are particularly dangerous because the injured rider may not receive timely medical attention.
- Heavy vehicle collisions — Crashes involving commercial trucks, buses, or other large vehicles carry a disproportionately high fatality risk for cyclists due to the extreme mass differential and the extensive blind spots associated with larger vehicles. These collisions, while less frequent than passenger car incidents, account for an outsized share of cyclist deaths statewide.
Cyclist-Side Contributing Factors
While driver behavior dominates the crash causation data, cyclist-side factors also play a role. Impairment among cyclists is a notable concern. As detailed in the alcohol and drug use section of this report, the observed ratio of impaired cyclists to impaired drivers in Phoenix bicycle collisions was approximately 7:1 over a five-year period. Other cyclist-related factors include riding against the direction of traffic, failing to use lights at night, distracted cycling, and navigating hazardous road surface conditions such as potholes, railroad track crossings, and loose gravel.
It is worth noting that single-bicycle crashes, where a rider falls or loses control without any motor vehicle involvement, are frequently unreported to law enforcement and therefore absent from ADOT’s official statistics. National studies on bicycle crash underreporting suggest that actual incident totals may be two to four times higher than what police-reported data reflects.
Bicycle Accident Statistics by County in Arizona
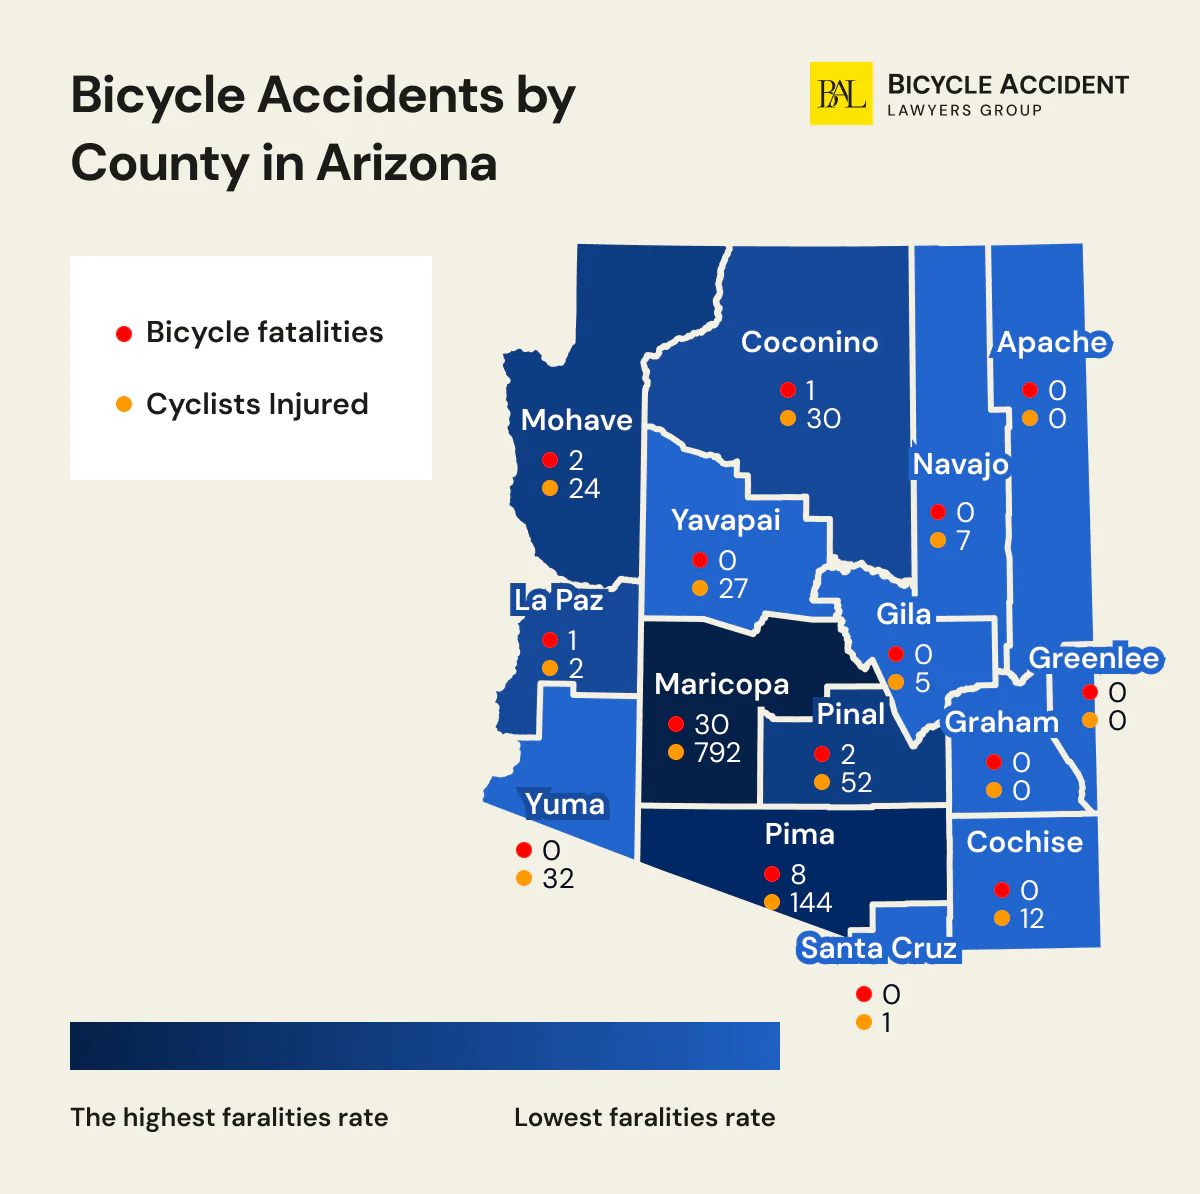
Maricopa County, home to Phoenix, Mesa, Scottsdale, Tempe, Chandler, and Glendale, consistently records the highest number of bicycle crashes in Arizona, accounting for approximately 70% of all incidents statewide. Pima County, which includes Tucson, ranks a distant second at roughly 13%. Together, these two counties account for over 83% of all bicycle-related collisions in the state.
Some counties reported zero or near-zero bicycle accidents in 2023, while others had hundreds. A closer look at the available stats helped our experts spot the following trends:
- Urban centres such as Maricopa and Pima showed the highest accident rates.
- Fatality rates across the counties seem not to be proportional to the overall traffic volume. For instance, in Pima, there were eight deadly accidents, but they make up a little over 5% of all bicycle crashes.
- In most counties in Arizona, the injury rates make up around 85%-95% of all bicycle accidents.
| County | Total bicycle crashes | Bicycle fatalities | Cyclists Injured |
| Apache | 0 | 0 | 0 |
| Cochise | 12 | 0 | 12 |
| Coconino | 27 | 1 | 30 |
| Gila | 5 | 0 | 5 |
| Graham | 0 | 0 | 0 |
| Greenlee | 0 | 0 | 0 |
| La Paz | 3 | 1 | 2 |
| Maricopa | 796 | 30 | 792 |
| Mohave | 26 | 2 | 24 |
| Navajo | 7 | 0 | 7 |
| Pima | 150 | 8 | 144 |
| Pinal | 53 | 2 | 52 |
| Santa Cruz | 1 | 0 | 1 |
| Yavapai | 27 | 0 | 27 |
| Yuma | 32 | 0 | 32 |
Counties with zero or near-zero reported bicycle crashes, such as Apache, Graham, and Greenlee, are predominantly rural. However, as the urban vs. rural data later in this report confirms, rural bicycle accidents carry a disproportionately higher fatality risk due to higher vehicle speeds, limited emergency response infrastructure, and reduced road lighting.
Bicycle Accident Statistics by Gender in Arizona
ADOT data reveals a stark gender disparity in Arizona’s bicycle crash outcomes. A five-year survey reflects the following trends:
-
- Male cyclists are more prone to getting in bike crashes. In 2023, 86% of bicycle fatalities and 78% of injured riders were composed of male bicyclists.
- Female cyclists are five times less likely to get into bicycle accidents.
- The highest rate of female bicycle crashes was recorded in 2022; 9 women lost their lives on the roads of Arizona, and 246 sustained serious injuries.
| Year | Total bicycle fatalities | Male bicyclists killed | % | Female bicyclists killed | % | Total Injuries | Male cyclists injured | % | Female cyclists injured | % |
| 2019 | 30 | 25 | 83% | 5 | 17% | 1,259 | 964 | 77% | 295 | 23% |
| 2020 | 33 | 28 | 85% | 5 | 15% | 812 | 634 | 78% | 178 | 22% |
| 2021 | 45 | 36 | 80% | 9 | 20% | 1,005 | 791 | 79% | 214 | 21% |
| 2022 | 48 | 39 | 81% | 9 | 19% | 1,128 | 882 | 78% | 246 | 22% |
| 2023 | 44 | 38 | 86% | 6 | 14% | 1,128 | 880 | 78% | 240 | 22% |
Nationally, NHTSA reports that male cyclists account for approximately 88% of all pedalcyclist fatalities, closely aligning with Arizona’s 86% figure in 2023. This gender disparity is widely attributed to higher male cycling exposure rates. Men make up a larger share of both commuting and recreational cyclists, and some studies also point to a greater prevalence of risk-taking behavior during rides.
Bicycle Accident Statistics by Age in Arizona
Age is a significant predictor of bicycle crash severity in Arizona. We’ve observed the following trends:
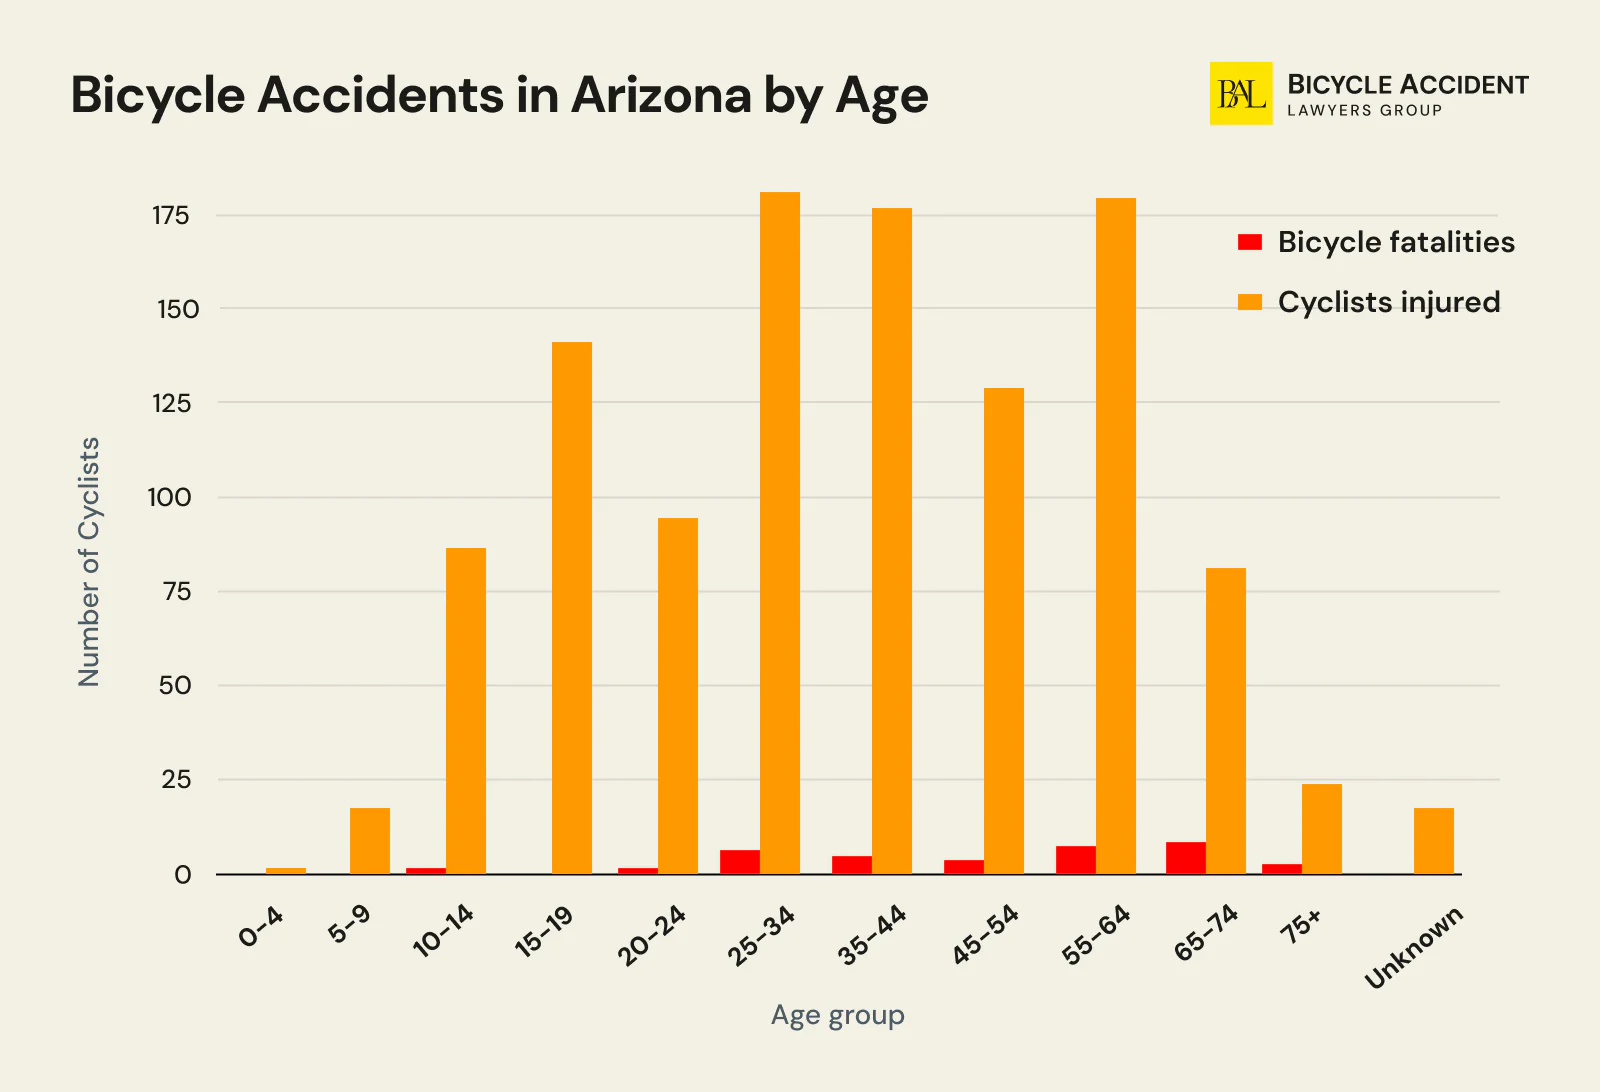
- Older cyclist groups, aged between 55 to 74, have the highest bicycle fatalities.
- Adult riders between 25 and 44 years sustained the most injuries while riding bikes in Arizona.
- Younger children and teenage groups show moderate injury rates.
- The lowest fatality rate in Arizona is among children and younger adults in their early 20s.
- A small number of bicycle accidents remained unreported, which proves the timely reporting of incidents in the area.
| Age | Bicycle fatalities | Cyclists Injured |
| 0-4 | 0 | 1 |
| 5-9 | 0 | 17 |
| 10-14 | 1 | 87 |
| 15-19 | 0 | 140 |
| 20-24 | 1 | 91 |
| 25-34 | 7 | 183 |
| 35-44 | 6 | 178 |
| 45-54 | 5 | 129 |
| 55-64 | 9 | 180 |
| 65-74 | 10 | 82 |
| 75 & Older | 5 | 24 |
| Unknown | 0 | 16 |
As the table above shows, cyclists aged 55–74 account for the highest share of Arizona’s bicycle fatalities according to ADOT’s age and gender data, even though younger age groups sustain more total injuries. This is not unique to Arizona. The CDC reports that adults ages 55–69 have the highest bicycle death rates nationwide based on WISQARS data, and NHTSA research shows the average age of cyclists killed in traffic has been climbing steadily for two decades as America’s cycling population gets older.
Why are older riders more likely to die in the same crash a younger cyclist might survive? The answer comes down to the body itself: reduced bone density, longer recovery times, and a higher risk of traumatic brain injury all make the consequences of a collision more severe after age 55. This reality reinforces why Arizona municipalities need to adopt Safe System design principles that protect every road user, not just the youngest and most resilient.
On the other end of the age spectrum, organizations like Safe Routes to School work with Arizona school districts to reduce pedestrian and bicycle crash risk during school commute hours. This is a contributing factor to the 3 PM–6 PM injury peak observed in Phoenix data discussed later in this report.
Bicycle Accident Statistics by Injury Severity in Arizona
We’ve categorized bike accident injury severity according to four criteria: fatal, serious, minor, and possible. Here’s how a five-year survey outlines the trends:
- On average, 140 bike riders suffer serious traumas after a bicycle accident in Arizona.
- Minor injuries predominate in bicycle accidents recorded across the state over five years. A small drop was observed in 2020-2021, but overall, the trend remains steady, and around 600 people suffer from scrapes and bruises sustained in bike crashes annually.
- Even though possible injuries make up around 30%-35% of all, the statistics prove that cycling in Arizona remains a risk-prone activity, and you may need to educate yourself on your legal rights and responsibilities.
| Year | Total injuries | Bicycle fatalities | Cyclists sustained serious injuries | Cyclists sustained minor injuries | Possible injuries |
| 2019 | 1,275 | 30 | 151 | 660 | 448 |
| 2020 | 830 | 33 | 122 | 407 | 283 |
| 2021 | 1,027 | 45 | 135 | 541 | 329 |
| 2022 | 1,159 | 48 | 138 | 627 | 363 |
| 2023 | 1,139 | 44 | 148 | 643 | 337 |
Economic Cost of Bicycle Accidents in Arizona
Beyond the human toll, bicycle crashes carry a substantial economic burden. ADOT’s Crash Facts report quantifies statewide economic losses from motor vehicle crashes, which exceeded $23 billion in 2024. Bicycle-involved crashes contribute to these costs through emergency medical services, hospital discharge expenses, lost productivity, and long-term rehabilitation. The average economic cost per injury crash in Arizona is estimated at approximately $116,000, while the average cost per fatal crash exceeds $1.7 million, according to ADOT’s state-adjusted crash cost methodology. Nationally, the CDC estimates that medical costs for bicycle-related injuries totaled approximately $3.1 billion in 2023, with average work loss costs reaching around $18,000 per incident.
These economic figures are central to the benefit-cost analyses that federal and state transportation agencies use to evaluate and justify bicycle safety investments. The U.S. Department of Transportation’s current value of a statistical life, approximately $12.5 million, anchors the calculations behind grant-funded projects such as Safe Streets and Roads for All (SS4A), where the projected reduction in crashes must demonstrate a favorable return relative to infrastructure costs.
Bicycle Accident Statistics by Area Type
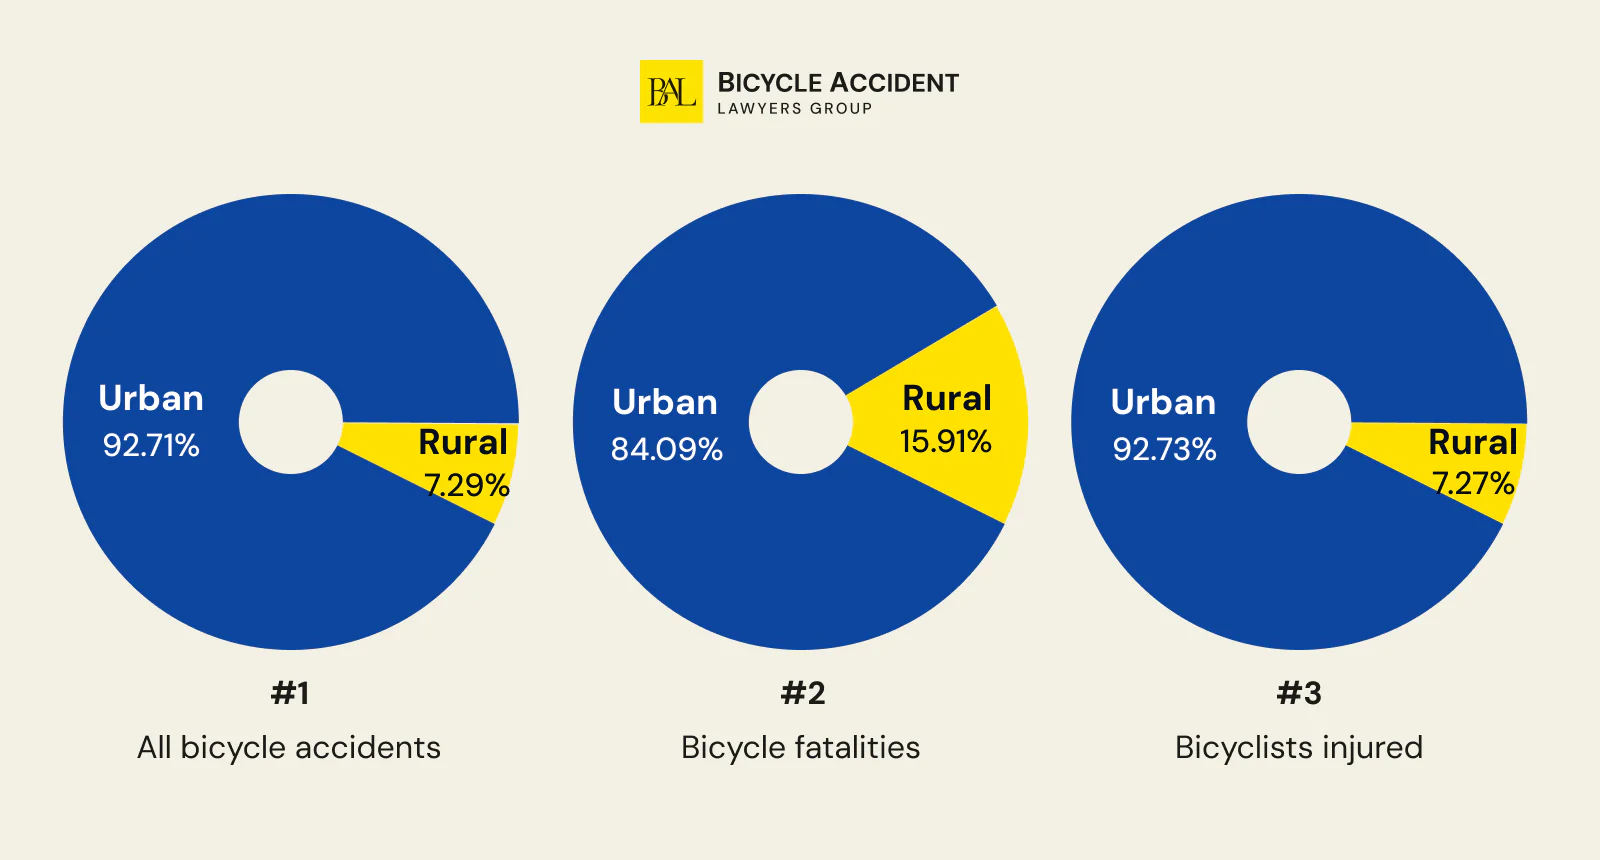
Over 90% of bicycle crashes in Arizona occur in urban areas, but rural crashes carry a disproportionately higher fatality risk. We’ve divided the Grand Canyon State into two primary areas: urban and rural. Here are the numbers that we’ve got:
The statistical data proves that while urban areas of Arizona still require better traffic separation and other infrastructure-related upgrades, rural zones need visibility enhancements and, potentially, emergency support improvement.
If you know where most bicycle accidents take place in Arizona, it will help you stay more alert while navigating those parts. Besides, awareness of potentially dangerous zones will ensure that you can use your resources more effectively. We’ve divided the Grand Canyon State into two primary areas: urban and rural. Here are the numbers that we’ve got:
| Category | Total | Urban | % | Rural | % |
| All bicycle accidents | 1,139 | 1,056 | 92.71% | 83 | 7.29% |
| Bicycle fatalities | 44 | 37 | 84.09% | 7 | 15.91% |
| Bicyclists injured | 1,128 | 1,046 | 92.73% | 82 | 7.27% |
The disproportionate rural fatality rate is a critical detail: 15.9% of deaths come from just 7.3% of crashes. Rural Arizona roads frequently have posted speed limits of 45–55 mph, where the impact speed in a vehicle-bicycle collision produces forces far more likely to result in fatal or serious injury. Highway safety research, including studies referenced in the FHWA Highway Safety Manual, consistently shows that crash severity increases exponentially with vehicle speed at the point of impact.
Traffic calming countermeasures, including speed tables, raised crosswalks, road diets that reduce lane widths, and reduced speed zones, have been shown to lower vehicle impact speeds in high-risk corridors. However, these measures remain uncommon on Arizona’s rural arterial roads, where the combination of high posted speed limits and minimal bicycle infrastructure creates the conditions for the state’s most severe crashes.
Bicycle Accident Statistics by Location Type
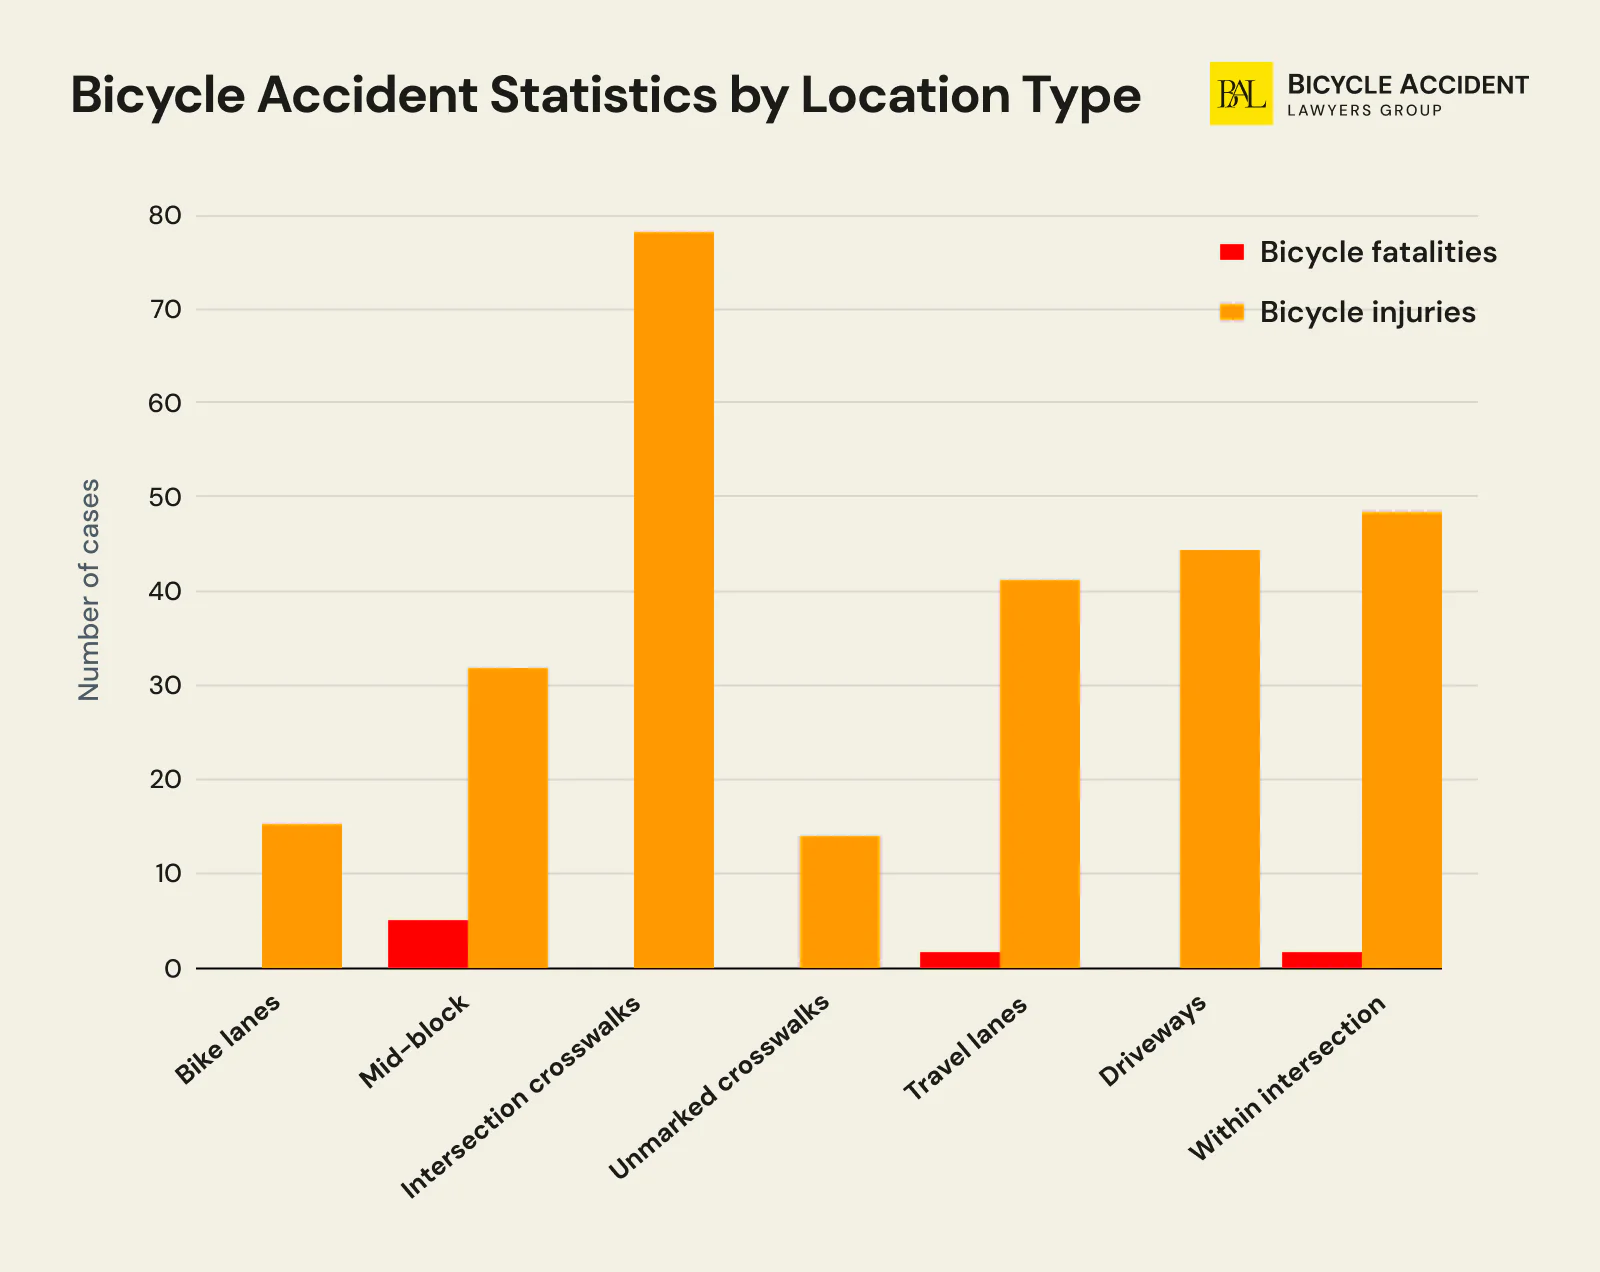
Since Phoenix accounts for the majority of Arizona’s bicycle crashes, location-level data from the largest city in the state reveals where collisions concentrate:
- Driving in dedicated bike lanes still poses a danger, so you must always mind your surroundings.
- Mid-block collisions are the deadliest of all. Over 14% of all bicycle accidents that happen in the location are fatal.
- Over 96% of incidents that inflicted injuries of varying scale on riders took place within intersections.
- Almost 5% of travel lane collisions turn out to be deadly.
| Type of location | All bicycle accidents | Bicycle fatalities | Bicycle injuries | % of total |
| Bike lanes | 16 | 0 | 16 | 6% |
| Mid-block | 37 | 5 | 32 | 13% |
| Intersection crosswalks | 78 | 0 | 78 | 27 |
| Unmarked crosswalks | 13 | 0 | 13 | 5% |
| Travel lanes | 43 | 2 | 41 | 15% |
| Driveways | 44 | 0 | 44 | 15% |
| Within intersection | 51 | 2 | 49 | 18% |
The location data shows that 16 crashes occurred within designated bike lanes, a reminder that not all bicycle infrastructure provides equal protection. Painted bike lanes offer lane delineation through road markings but no physical barrier between cyclists and motor vehicle traffic. Protected bike lanes, by contrast, use vertical separation such as bollards, planters, or raised curbs to prevent vehicle encroachment and eliminate dooring risk from parked cars. Peer-reviewed research consistently shows that protected bike lanes reduce bicycle crash rates by 50–90% compared to painted alternatives, depending on corridor and intersection design.
Most Dangerous Roads for Cyclists in Phoenix
The City of Phoenix analyzed its pedestrian and bicycle crash data to create a High Injury Network (HIN), a map identifying the roads and corridors with the highest concentration of cyclist injuries and fatalities. The most dangerous roads for bicyclists in Phoenix include:
- Indian School Road
- McDowell Road
- Thomas Road
- Buckeye Road
These arterial roads carry high traffic volumes, often lack protected bicycle infrastructure, and feature multi-lane configurations that increase conflict points between motor vehicles and bicyclists.
Most Dangerous Intersections for Cyclists in Phoenix
Phoenix’s HIN data also pinpoints specific intersections with elevated bicycle crash rates. Among the highest-risk intersections identified are:
- McDowell Road and 27th Avenue
- Buckeye Road and 7th Avenue
- Indian School Road and 3rd Avenue
- Thomas Road and 43rd Avenue
Intersection crashes account for the largest share of urban bicycle collisions, driven primarily by right-hook crashes, failure-to-yield violations, and limited sight lines at multi-lane crossings.
Surely, knowing about these high-risk locations in the city won’t rule out a chance of getting hurt in an incident. However, having a committed Phoenix bicycle accident lawyer at hand can make a tremendous difference when you seek a fair Phoenix bicycle accident settlement. Bicycle Accident Lawyers Group is a law firm well-versed in local laws and willing to reach a helping hand should the need arise!
Bicycle Accident Statistics by Time of Day
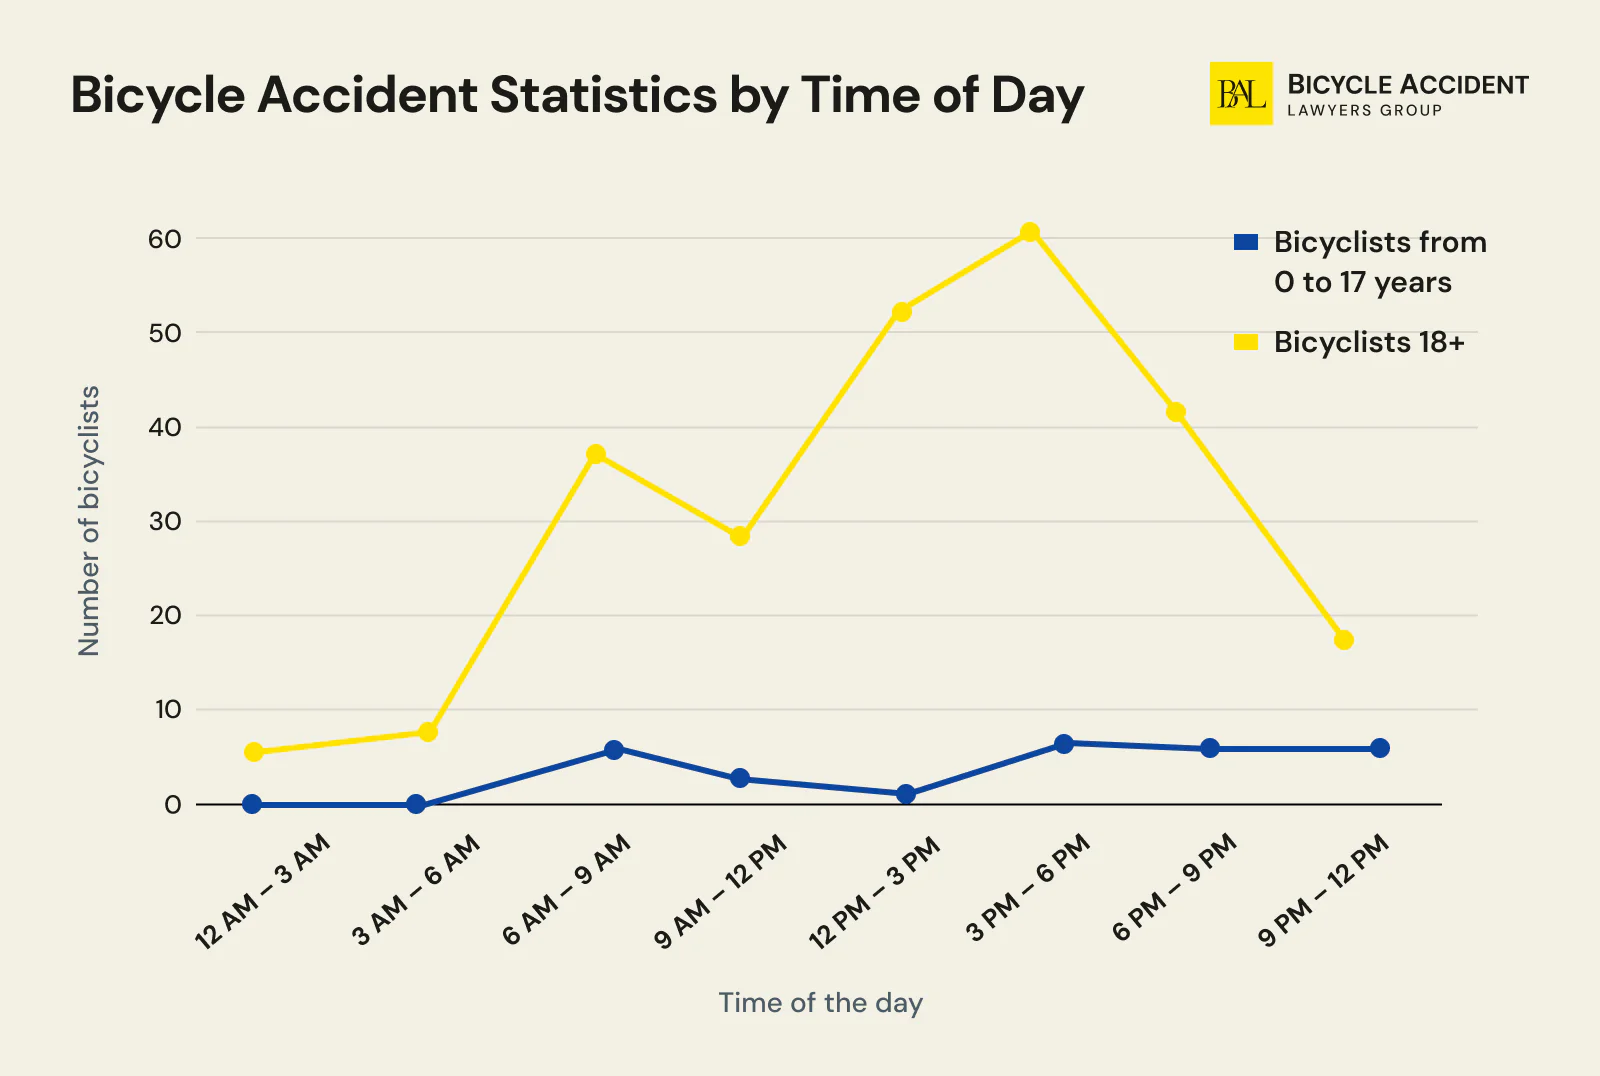
The peak period for bicycle accidents in the Phoenix metropolitan area falls between 3 PM and 6 PM, coinciding with school dismissal and the evening commute. However, nighttime crashes between 6 PM and 9 PM are disproportionately fatal. Approximately 39–40% of cyclist deaths occur after dark despite only 21–22% of incidents happening at night.
Statewide time-of-day data is not published by ADOT, but Phoenix provides a detailed breakdown that reflects related trends vividly:
- The afternoon hours list the most bicycle accidents across the city among both children and adults. The main reason may be school dismissal time and after-work commuting.
- Decreased cyclist activity is reflected by the drop in collisions during late-night hours.
- The 3 PM–6 PM window poses a particular risk for young riders aged 0–17, who account for 7 of 29 youth crashes during this peak window.
- Decreased visibility during 6 PM–9 PM may be one of the major contributing factors that lead to spikes in bicycle crashes.
| Time of the day | Bicyclists from 0 to 17 years | Bicyclists 18+ |
| 12 AM – 3 AM | 0 | 6 |
| 3 AM – 6 AM | 0 | 8 |
| 6 AM – 9 AM | 6 | 38 |
| 9 AM – 12 PM | 3 | 29 |
| 12 PM – 3 PM | 1 | 53 |
| 3 PM – 6 PM | 7 | 61 |
| 6 PM – 9 PM | 6 | 42 |
| 9 PM – 12 PM | 6 | 18 |
The concentration of fatal crashes during evening and nighttime hours points directly to visibility and conspicuity as addressable risk factors. Improved street lighting on high-crash arterial corridors, mandatory front and rear bicycle-mounted lights after dark, and retroreflective clothing and accessories can each reduce a cyclist’s risk of being struck. Several Phoenix HIN corridors, including Indian School Road and McDowell Road, have been identified as priorities for lighting upgrades as part of the city’s pedestrian and bicycle safety action plan.
Bicycle Accident Statistics by Day of the Week
Bicycle Accident Statistics by Day of the Week
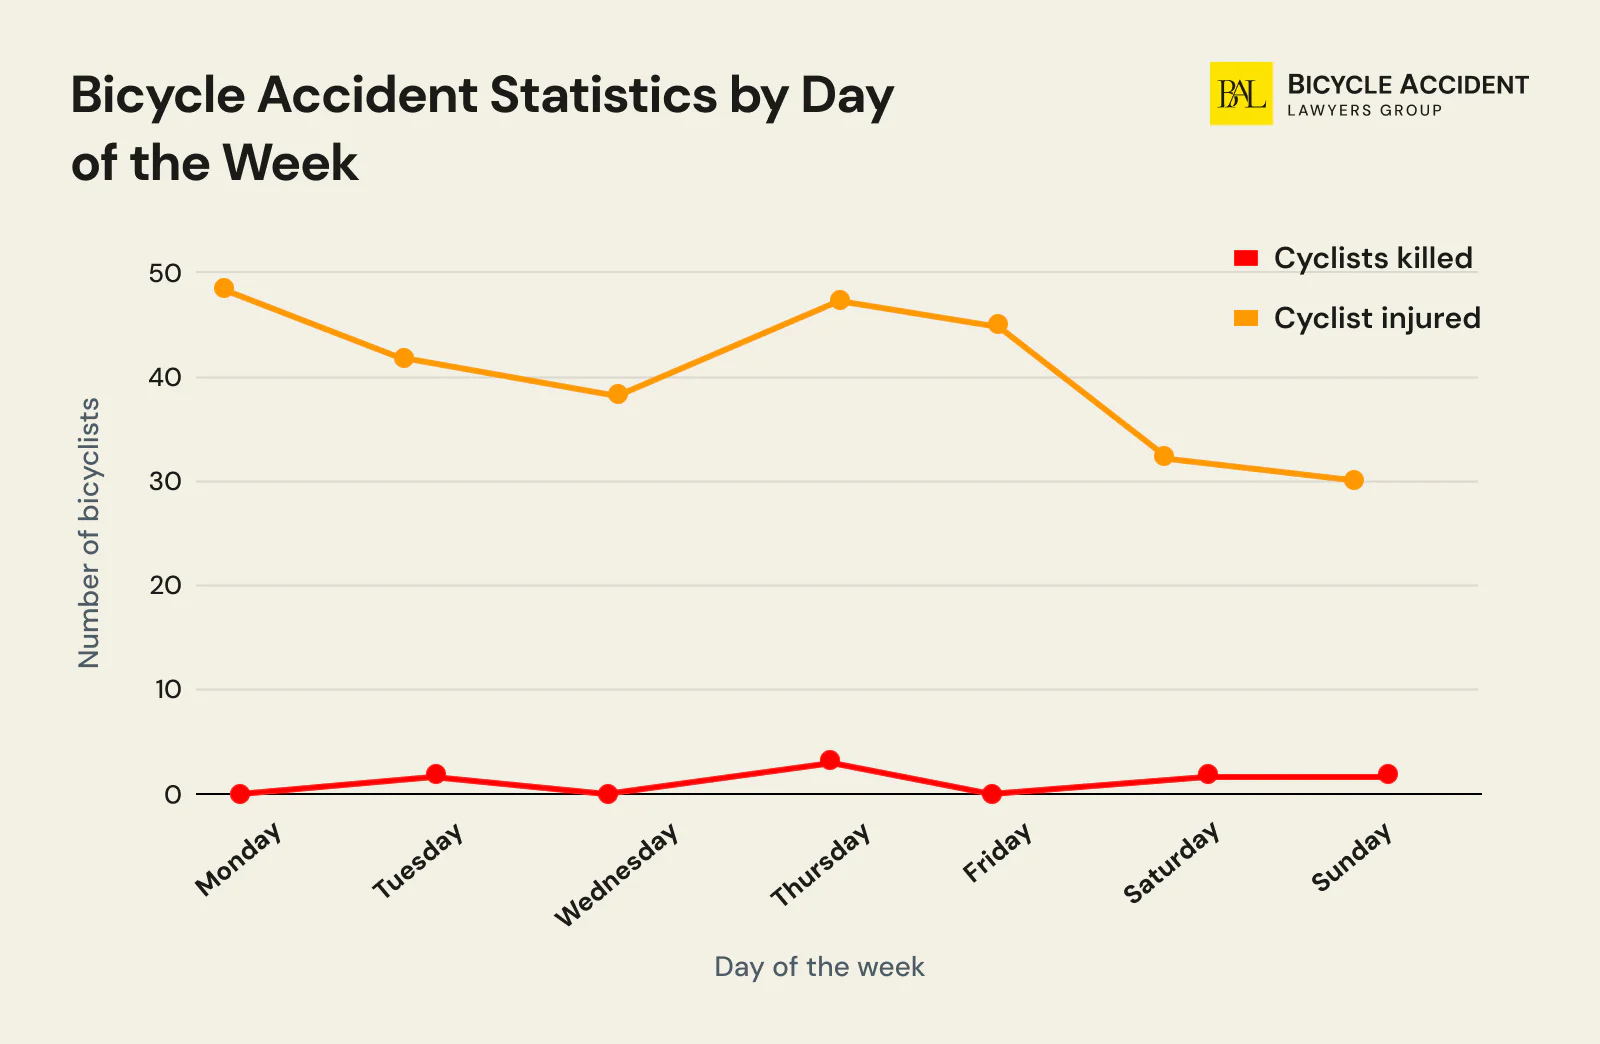
Phoenix data also reveals distinct day-of-week patterns in bicycle crashes:
- Thursday was reported to be the deadliest day of the week. Three people lost their lives on Thursdays in Phoenix. The most likely explanation for this spike in bicycle fatalities would be the overall surge before the weekend.
- As opposed to the end of the week, its beginning, Mondays in particular, show that rushed commuting to work and school brings increased numbers of cyclist collisions in the area.
- Midweek seems to be relatively safe for biking. At least the report shows that no people died in a cycling incident on Wednesday in Phoenix, and the overall injury rate dropped to 38 bicyclists hurt.
- Weekend bicycle accidents led to four people being fatally injured. An increase in recreational riding as well as alcohol consumption may be the primary culprits behind these stats.
| Day of the week | Cyclists killed | Cyclist injured |
| Monday | 0 | 49 |
| Tuesday | 2 | 42 |
| Wednesday | 0 | 38 |
| Thursday | 3 | 48 |
| Friday | 0 | 45 |
| Saturday | 2 | 32 |
| Sunday | 2 | 30 |
The weekday crash pattern aligns with commuting exposure, while weekend spikes correlate with increased recreational cycling activity and, notably, elevated alcohol-related incident rates on Friday and Saturday evenings.
Bicycle Accident Statistics by Month
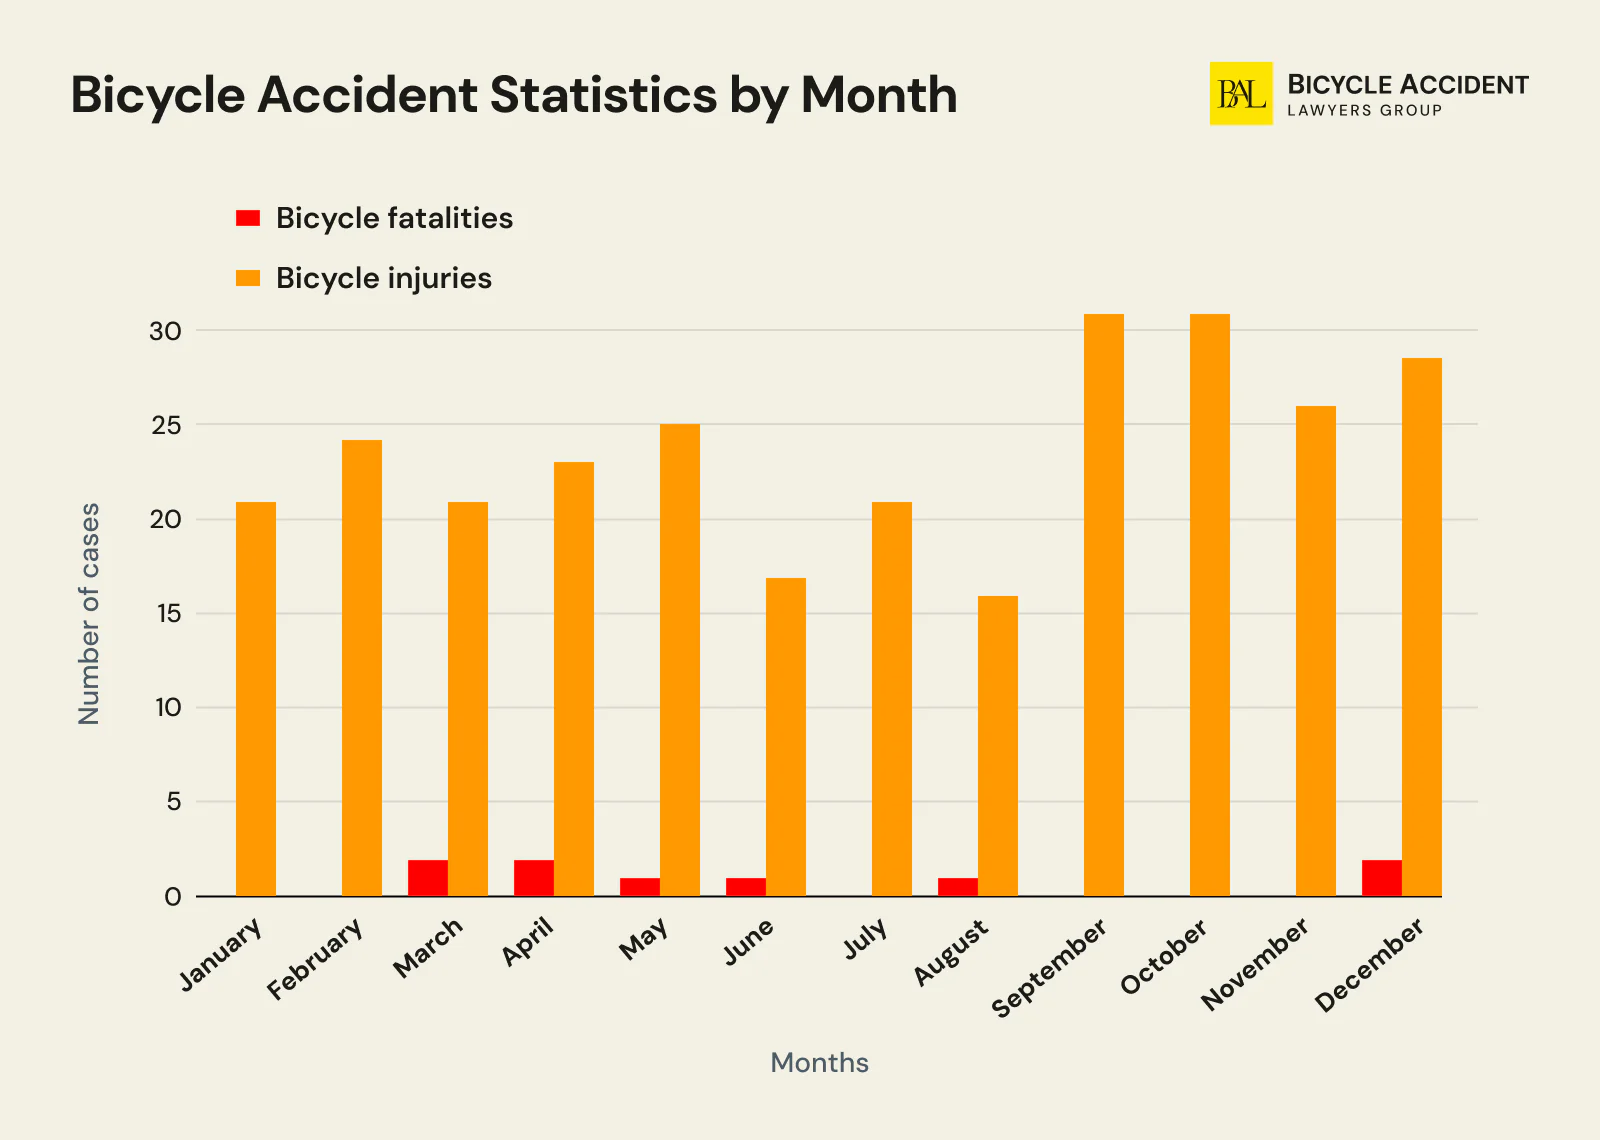
Monthly data is limited to Phoenix, where strong seasonal patterns emerge:
- December, March, and April happened to be the deadliest months for cyclists in Phoenix. Six riders sustained fatal injuries during these months. Limited visibility on the road during the early winter and spring months may be the common denominator for these unfavourable stats.
- Autumn months, especially September and October, saw a surge in bicyclist injuries, potentially due to pleasant weather that led to increased numbers of people biking through the city.
- Extreme heat during the summertime period in Phoenix and Arizona (e.g., Phoenix averages 106°F in July), in general, ensures that there are fewer riders on the streets, thus causing a drop in bicycle fatalities and injuries.
| Month | Bicycle fatalities | Bicycle injuries |
| January | 0 | 21 |
| February | 0 | 24 |
| March | 2 | 21 |
| April | 2 | 23 |
| May | 1 | 25 |
| June | 1 | 17 |
| July | 0 | 21 |
| August | 1 | 16 |
| September | 0 | 31 |
| October | 0 | 31 |
| November | 0 | 26 |
| December | 2 | 28 |
This seasonal pattern is characteristic of Arizona’s Sonoran Desert climate. NOAA records confirm that Phoenix averages daytime highs above 100°F from June through September, naturally suppressing cycling activity during peak summer and creating a bimodal distribution with spring and fall injury peaks.
Bicycle Accident Statistics by Weather Conditions in Arizona
Bicycle Accident Statistics by Weather Conditions in Arizona
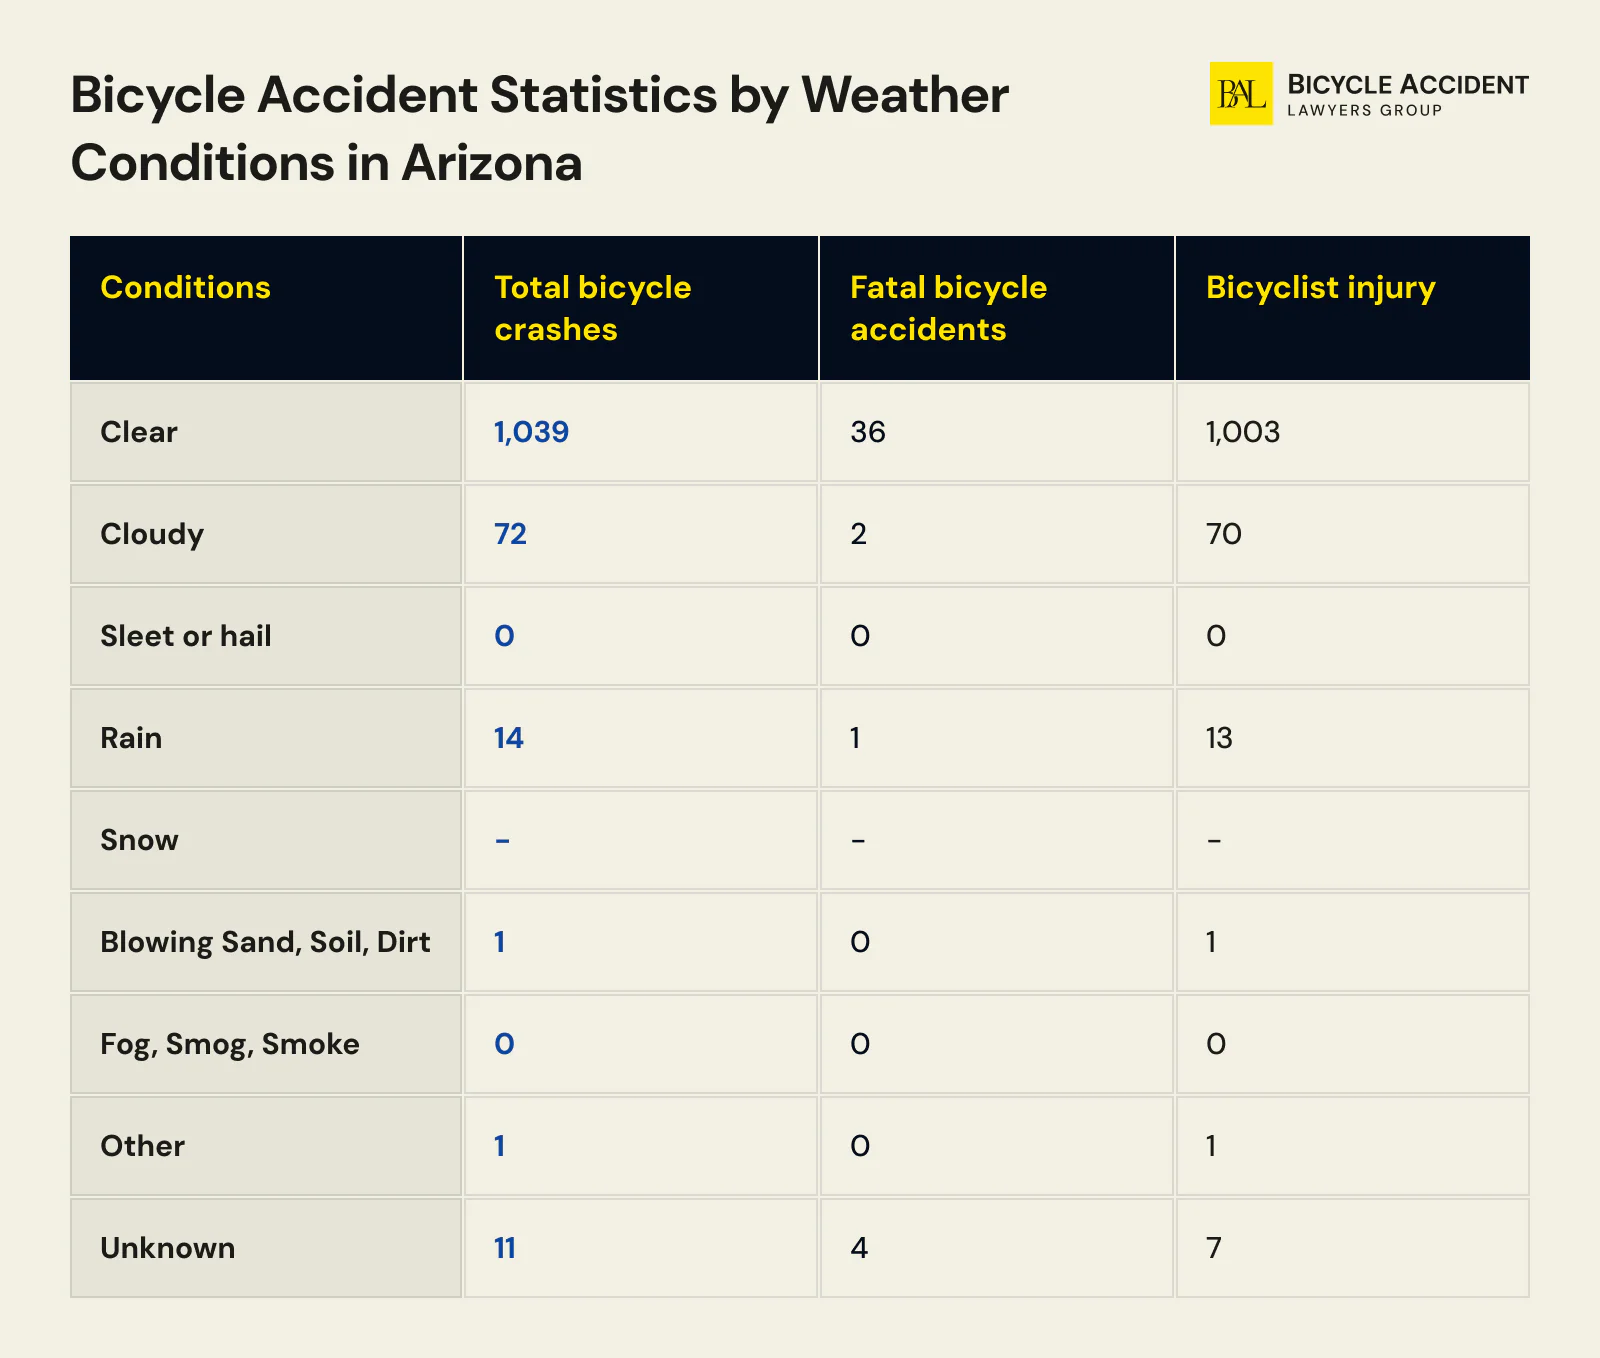
Over 92% of bicycle crashes in Arizona occur in clear weather conditions. Unlike a motor vehicle operator, a cyclist isn’t as protected against potentially unfavourable weather, yet the data confirms that crash causation in the state is predominantly behavioral. It is driven by distracted driving, rider errors, and infrastructure gaps rather than environmental factors. This pattern aligns with NHTSA’s national analysis, which shows that weather is a contributing factor in fewer than 10% of bicycle-involved crashes.
Another factor that may be worth your attention is that 11 bicycle crashes happened under unknown conditions, which stands for a lack of reporting clarity.
| Conditions | Total bicycle crashes | Fatal bicycle accidents | Bicyclist injury |
| Clear | 1,039 | 36 | 1,003 |
| Cloudy | 72 | 2 | 70 |
| Sleet or hail | 0 | 0 | 0 |
| Rain | 14 | 1 | 13 |
| Snow | |||
| Blowing Sand, Soil, Dirt | 1 | 0 | 1 |
| Fog, Smog, Smoke | 0 | 0 | 0 |
| Other | 1 | 0 | 1 |
| Unknown | 11 | 4 | 7 |
Bicycle Accident Stats by Alcohol and Drug Use
Bicycle Accident Stats by Alcohol and Drug Use
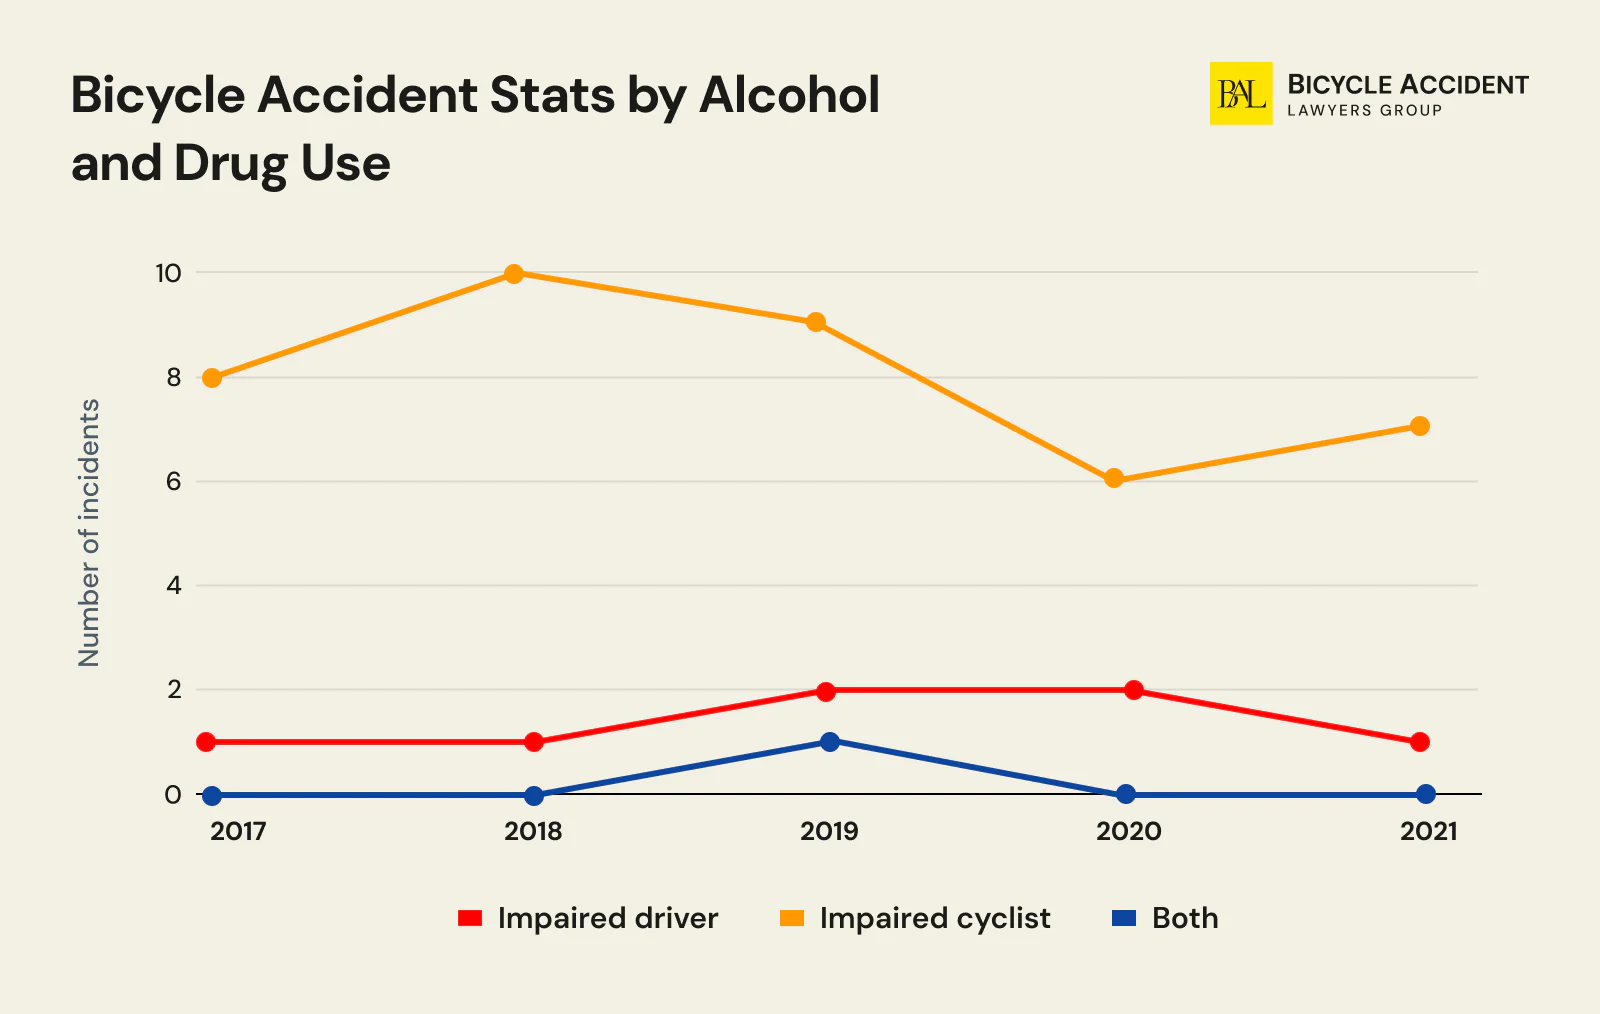
Phoenix’s bicycle-related report provides an in-depth look into bicycle accidents that happened because of alcohol or drug involvement. From the table below, you can see the following patterns:
- Impairment among cyclists is prevalent, rather than among motor vehicle operators who are involved in collisions. The ratio observed over five years is 1:7.
- There was a single accident when both parties involved were operating under the influence, which means that impaired bike riders (above 0.08% blood alcohol concentration (BAC)) were a more isolated risk factor, at least on the streets of Phoenix City.
- It is important to note that 14% of these collisions result in fatalities, and the same percentage of victims sustain serious injuries.
- After 2019, we can observe a slight decline in such collisions, which may signify increased awareness among bicyclists, cyclist safety campaigns, and improved cycling habits.
| Year | Impaired driver | Impaired cyclist | Both |
| 2017 | 1 | 8 | 0 |
| 2018 | 1 | 10 | 0 |
| 2019 | 2 | 9 | 1 |
| 2020 | 2 | 6 | 0 |
| 2021 | 1 | 7 | 0 |
Nationally, NHTSA reports that approximately 22% of bicyclists killed in crashes had a blood alcohol concentration of 0.08 g/dL or higher. Arizona’s data showing a 7:1 ratio of impaired cyclists to impaired drivers in Phoenix bicycle collisions indicates that cyclist impairment is a more prevalent local factor than in many other states.
E-Bike Crash Statistics in Arizona
A note on Arizona’s e-bike data: ADOT’s annual Crash Facts reports do not separately categorize e-bike crashes from traditional bicycle crashes. Every Arizona bicycle statistic in this article — statewide totals, fatality counts, injury figures — covers the full “pedalcyclist” category, which includes e-bike riders. Beginning in 2022, NHTSA reclassified motorized bicycles (including e-bikes) as pedalcyclists in its national FARS data. For e-bike-specific crash statistics, the CPSC Micromobility report remains the most detailed federal source available. Some e-bike incidents may also be miscoded as motorcycle or moped crashes in state databases, meaning the true e-bike crash count is likely higher than what any single source captures.
Arizona classifies electric bicycles under A.R.S. § 28-819 into three classes:
| E-Bike Class | Motor Type | Max Speed | Arizona Path Access |
|---|---|---|---|
| Class 1 | Pedal-assist only | 20 mph | Bike paths and lanes permitted |
| Class 2 | Throttle-assisted | 20 mph | Bike paths and lanes permitted |
| Class 3 | Pedal-assist only | 28 mph | Roadways only; restricted from most paths |
National E-Bike Fatality and Injury Data
Because neither Arizona nor most states publish standalone e-bike crash statistics, the best available e-bike-specific data comes from the CPSC’s national surveillance system. The numbers reveal that e-bikes are now the deadliest category of micromobility device in the United States:
| Metric | Value | Period | Source |
|---|---|---|---|
| E-bike fatalities nationwide | 193 | 2017–2023 | CPSC Micromobility Report |
| E-bike share of all micromobility deaths | 52% | 2017–2023 | CPSC Micromobility Report |
| Male share of e-bike fatalities | 81.3% (157 of 193) | 2017–2023 | CPSC Micromobility Report |
| All micromobility ED visits (e-bikes, e-scooters, hoverboards) | 448,600 | 2017–2023 | CPSC Micromobility Report |
| All micromobility ED visits in 2023 alone | 87,800 | 2023 | CPSC Micromobility Report |
| Growth in annual micromobility ED visits | +158% (34,000 → 87,800) | 2017–2023 | CPSC Micromobility Report |
| Battery/fire-related fatalities (all micromobility) | 39 | 2017–2023 | CPSC Lithium-Ion Battery NPR |
| Battery/fire-related injuries (all micromobility) | 181 | 2017–2023 | CPSC Lithium-Ion Battery NPR |
Note: The first three rows above are e-bike specific. Rows 4–8 cover all micromobility products combined (e-bikes, e-scooters, and hoverboards) because the CPSC does not publish separate e-bike ED visit totals for most reporting years.
E-bikes account for 52% of all micromobility fatalities — more than e-scooters (44%) and hoverboards (4%) combined. The 81.3% male share of e-bike deaths mirrors Arizona’s own 86% male share of all bicyclist fatalities, suggesting the same demographic risk patterns apply to e-bike riders. The American College of Surgeons described e-bikes as “emerging as a public health threat” in 2024.
Why E-Bikes Are an Emerging Concern in Arizona
The core safety concern is speed. Class 1 and 2 e-bikes assist up to 20 mph, and Class 3 models reach 28 mph — roughly double a conventional bicycle’s 12–15 mph average. That speed gap increases impact severity and makes it harder for drivers to judge closing distances at intersections and driveways.
Several Arizona-specific factors make e-bike safety particularly urgent here:
- Crash environment — Arizona recorded 1,379 total bicycle crashes in 2024, a five-year high, and bicyclist and pedestrian fatalities have increased 90% since 2013 while the state’s population grew just 12%. These all-bicycle figures include e-bike riders, and the growth in e-bike adoption is contributing to this upward trend — though the exact e-bike share remains unmeasured in state data.
- Rider experience — Many e-bike riders are new to cycling or returning after long breaks, drawn by the motor assist but potentially less practiced in road awareness and bicycle handling at higher speeds.
- Helmet gaps — Arizona has no statewide helmet mandate for adult e-bike riders. Nationally, NHTSA data shows that 62% of pedalcyclists killed in 2023 were not wearing a helmet a figure that encompasses both traditional cyclists and e-bike riders.
- Nighttime and alcohol risk — Nationally, 53% of pedalcyclist fatalities in 2023 occurred after dark and 34% involved alcohol. These risk factors are amplified at e-bike speeds where reaction margins shrink. Arizona’s bicycle crash data shows a similar pattern, with crashes between 6 PM and midnight disproportionately fatal.
- Battery safety — Beyond crash injuries, the CPSC proposed a federal safety standard in January 2025 after documenting 227 incidents involving e-bike and micromobility battery fires, explosions, and electrical hazards from 2017 to 2023 — resulting in 39 fatalities and 181 injuries nationwide.
As e-bike registrations and shared e-bike accident systems expand in Phoenix, Tempe, and Scottsdale, this category will increasingly shape Arizona’s overall bicycle crash statistics strengthening the case for ADOT to begin tracking e-bike involvement as a distinct crash variable.
Arizona vs. National Bicycle Accident Comparison
Arizona’s bicyclist fatality rate exceeds the national average. Bicycle death statistics nationwide show that with approximately 44 cyclist deaths in 2023 and an estimated 19,114 bicycle commuters statewide, Arizona records roughly 2.62 bicyclist deaths per 1,000 bicycle commuters, placing it among the top 15 most dangerous states for cyclists, based on NHTSA Fatality Analysis Reporting System (FARS) data cross-referenced with Census Bureau American Community Survey figures.
| Metric | Arizona | National |
|---|---|---|
| Bicycle crashes (2024) | 1,379 | ~130,000 (est.) |
| Bicyclist fatalities (2023) | 44 | 1,084 |
| % of traffic fatalities that are cyclists | ~3.4% | 2.9% |
| Urban crash share | 92.7% | 82% |
| Male fatality share | 86% | 88% |
| Cyclist fatalities not wearing helmet | ~60%+ | 62.2% |
How Does Arizona Compare to Other States?
The research concept of “safety in numbers,” documented in peer-reviewed studies, suggests that states with higher cycling mode share tend to record lower per-capita cyclist fatality rates. Arizona’s relatively modest cycling mode share, combined with sprawling urban design, high-speed arterial roads, and limited separated bicycle infrastructure, contributes to a higher per-capita risk. States that have invested aggressively in protected bike lanes and adopted Vision Zero or Safe System strategies have demonstrated measurable reductions in cyclist fatalities, offering a roadmap for Arizona’s continued improvement.
The National Safety Council, CDC injury surveillance data, and the Consumer Product Safety Commission’s National Electronic Injury Surveillance System (NEISS) all provide additional context for understanding where Arizona falls in the national bicycle safety landscape.
First Steps to Take If You’ve Been in a Cycling Accident in Arizona
We won’t speculate on the odds of getting involved in a cycling collision in Arizona because every bicycle accident case is unique. However, our team has rounded up a list of practical steps to take after the crash to ensure your safety and protect your legal rights:
-
Protect yourself
If you can move away from the road, do so. In case you’ve been badly injured, try your best to make yourself visible so that no further harm comes.
-
Call for backup
Dial 911 as soon as you can. The sustained injuries and damage may not be as minor as they seem. While a trained medic will check your well-being, a police officer will ensure that no detail remains unreported.
-
Unleash your inner Sherlock Holmes
The better you document the scene, the easier it will be to assess your losses and file for a success-programmed and all-encompassing claim in Arizona. Take pictures of anything that stands out, no matter how unimportant it may seem.
-
Seek legal help
You can indeed use an online bicycle accident compensation calculator to estimate your losses and fill out the insurance claim form on your own. However, a field-tested legal expert knows all the ins and outs of the Arizona legal system. They have a keen eye for detail that can optimize your compensation, and learn how to negotiate with tricky insurers to deflect lowball offers aimed at you
Conclusion
Bicycle accident statistics in Arizona have an interesting story to tell. It isn’t all about dull figures and estimations. If you pay closer attention to the presented numbers, Arizona law, you will have a clearer picture in mind as to where, when, how, and why bicycle accidents occur. This information will help you enhance your safety and know your legal rights and obligations should anything happen.
Ride smarter, ride safer, and ride more prepared!

Since his academic days at the UC Berkeley School of Law, Robert Goldwater has remained a committed advocate for victims of other people’s negligence. His tort law background, together with his unquenchable thirst for justice, helped young Robert found a now-successful law firm – Bicycle Accident Lawyers Group, gathering same-minded and promising attorneys from all over the country.

