

- Key US Bicycle Accident Data
- Bicyclist Fatalities Trend Over Past Years
- Leading Factors in Bicycle Fatalities
- Bicycle Death Statistics by State
- 10 Most Dangerous States for Cyclists
- 10 Safest States for Cyclists
- Bicycle Death Statistics by City
- Bicycle Death Statistic by Month
- Bicycle Death Statistic by Time
- Bicycle Death Statistic by Location Type
- Bicycle Death Statistic by Age and Sex
- Bicycle Nonfatal Injury Statistics
- Bicycle Death Statistic by Helmet Use
- Bicycle Death with Alcohol in Blood Statistics
- Bicycle Death Statistics by Point of Impact
- Bicycle Death Statistics by Vehicle Type
- Effective Ways to Decrease Bicyclist Fatality Rates in the USA
- Conclusion
- Methodology and Data Sources
- Get a FREE case evaluation today
The 2026 complete bicycle accident statistics show that cycling remains a major part of how Americans get around. Americans logged about 2.2 billion bike trips in 2022, according to the National Household Travel Survey, with just over half for social or recreational purposes. Bike commuting is edging up too, from 0.4% of workers in 2021 to 0.5% in 2023 and 2024, according to the U.S. Census Bureau.
That popularity, however, has not come with proportional safety gains. Bicyclists account for about 1% of all U.S. travel but 2.8% of everyone killed in traffic. In 2024, the National Safety Council recorded 1,392 bicyclist deaths from all preventable causes. Federal crash data counted 1,103 in motor vehicle crashes, down 6% from a record 2023 but still roughly 77% higher than in 2010. This report breaks down the toll by state, city, age, road type, and time of day so that every number points to where the risk actually sits.
Key US Bicycle Accident Data
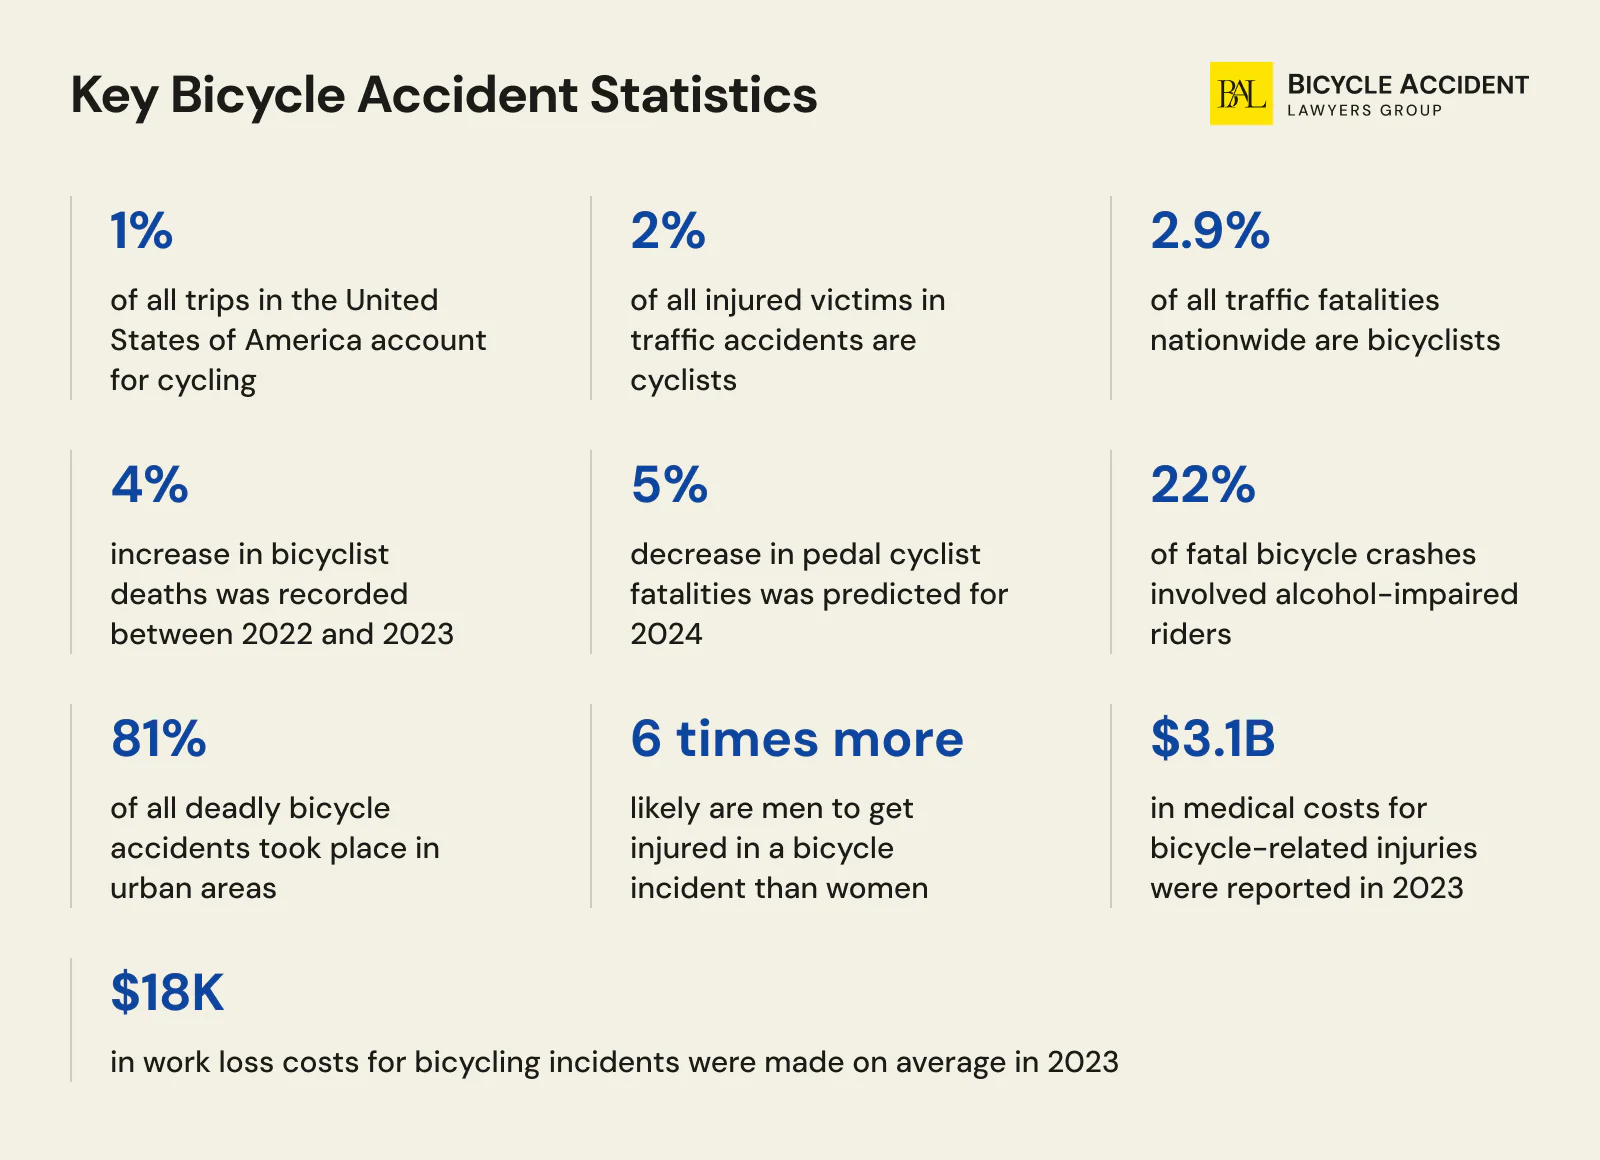
- Death Toll: 1,392 bicyclists died in 2024 (NSC, all causes). FARS counted 1,103 in motor-vehicle crashes. That is down 6% from 2023, the highest count since records began in 1975.
- Long-Term Trend: Motor-vehicle cyclist deaths rose 77% since 2010, from 623 to 1,103. The NSC count rose 37% in a decade, from 1,015 in 2015 to 1,392.
- Exposure Gap: Bicyclists take about 1% of US trips. They account for 2.8% of all traffic fatalities nationwide, nearly triple their share of the road.
- Nonfatal Injuries: 341,774 people were hurt on bikes in 2023. That is down 29% from 2014.
- Highest-Risk Groups: Adults 55 to 69 die at the highest rate of any age group. Children 10 to 14 land in the emergency room most often, about 245 per 100,000.
- Gender: Males account for 88% of bicycle deaths, over seven times the fatalities for females and about four times the injury rate.
- Location and Time: 81% of fatal crashes happened in urban areas in 2024. Low light covered 56% of them, in the dark, at dusk, or at dawn.
- Leading Causes: Front-end impacts caused 84% of cyclist deaths in 2024. Intersections accounted for 30%. Alcohol was in the driver’s or the rider’s system in 33% of fatal crashes.
- Top Risk States: Florida recorded 1,031 bicyclist deaths from 2020 to 2024 and California recorded 739, the two highest five-year totals in the country by a wide margin (NHTSA FARS).
- Economic Cost: Bicycle injuries cost $3.1 billion in medical care in 2022. Lost work adds about $18,000 per case (CDC WISQARS).
Bicyclist Fatalities Trend Over Past Years
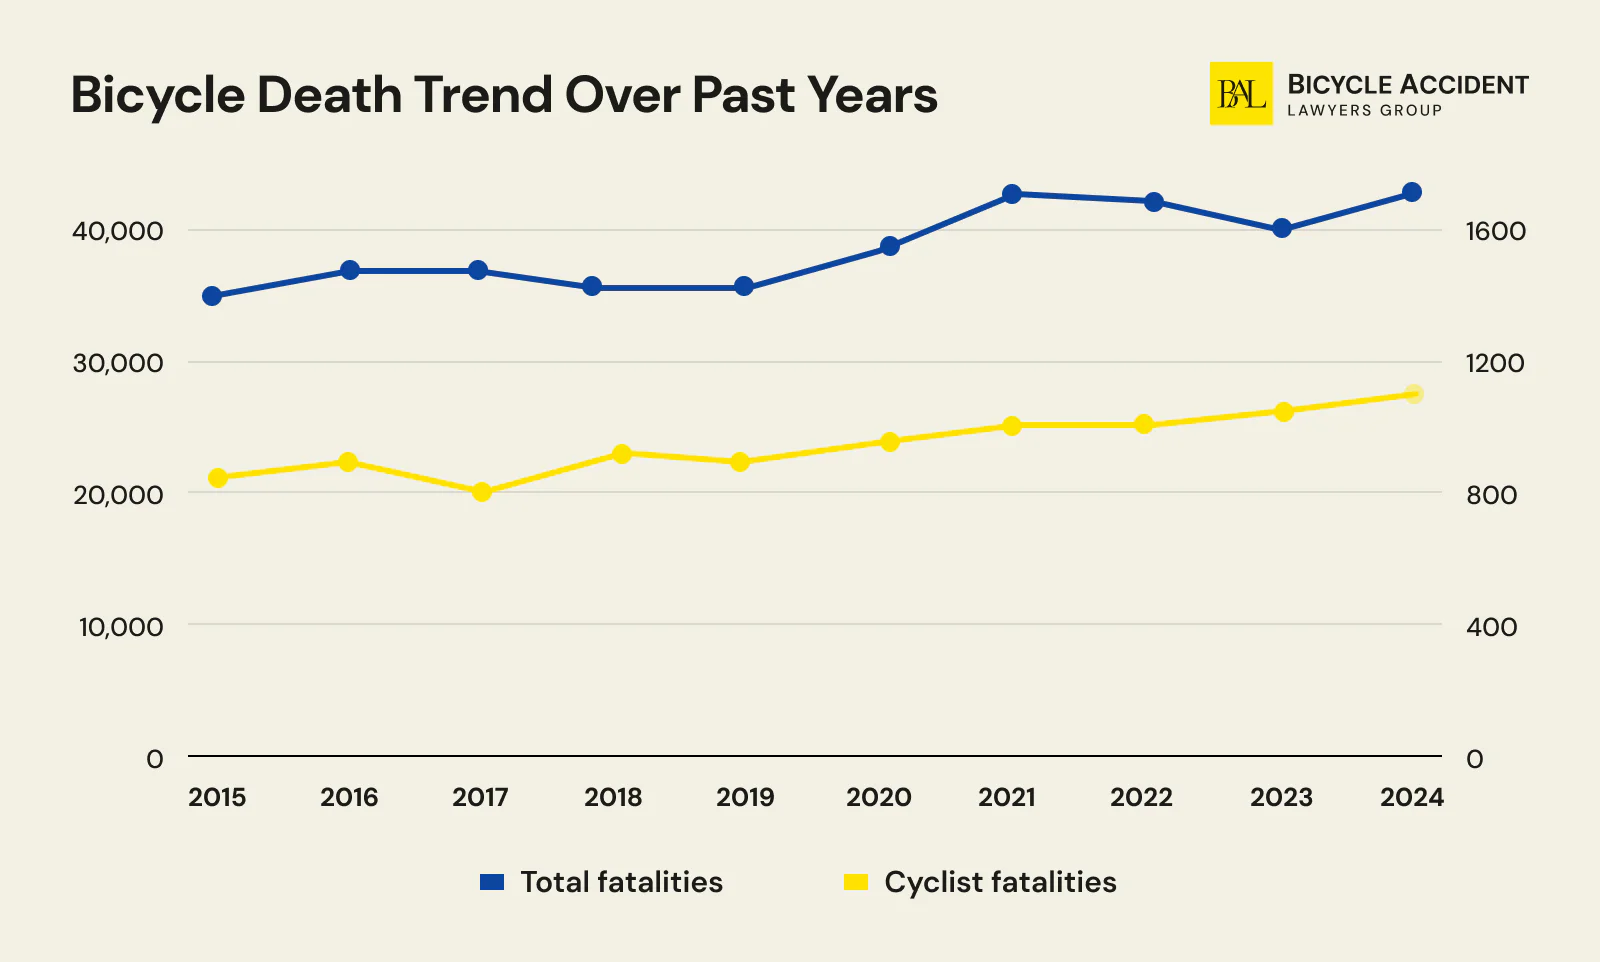
Cyclist deaths rose 77% between 2010 and 2024, while total traffic deaths rose 19% (NHTSA FARS). Riding got more dangerous faster than driving did. Bicyclists were 1.9% of everyone killed on American roads in 2010. By 2024 they were 2.8%.
The table below extends back to 2010 to provide the full baseline for the long-term trend:
|
Year |
Total fatalities |
Cyclist fatalities |
Percentage % |
|
2010 |
32,999 |
623 |
1.9 |
|
2011 |
32,479 |
682 |
2.1 |
|
2012 |
33,782 |
734 |
2.2 |
|
2013 |
32,894 |
749 |
2.3 |
|
2014 |
32,744 |
729 |
2.2 |
|
2015 |
35,484 |
829 |
2.3 |
|
2016 |
37,806 |
853 |
2.3 |
|
2017 |
37,473 |
806 |
2.2 |
|
2018 |
36,835 |
871 |
2.4 |
|
2019 |
36,355 |
859 |
2.4 |
|
2020 |
39,007 |
948 |
2.4 |
|
2021 |
43,230 |
976 |
2.3 |
|
2022 |
42,721 |
1,117 |
2.6 |
|
2023 |
41,025 |
1,173 |
2.9 |
|
2024 |
39,254 |
1,103 |
2.8 |
Note: The NHTSA FARS figures above track motor-vehicle-involved cyclist deaths only. The National Safety Council’s broader count, which includes non-motor-vehicle bicycle deaths, recorded 1,377 total bicyclist fatalities in 2023.
From 2010’s 623 motor-vehicle cyclist deaths to 2023’s 1,166, the increase is approximately 87%. When viewed over just the last decade (2013–2023), the increase is approximately 53%. Regardless of the baseline chosen, the trend is clear and troubling: bicycle fatalities are growing at a pace that far outstrips the growth in total traffic deaths.
Leading Factors in Bicycle Fatalities
Understanding why bicycle crashes turn fatal requires looking at the intersection of driver behavior, infrastructure design, and rider vulnerability. Three factors stand out in the data:
Motor-Vehicle Interaction
Most fatal bicycle crashes involve a collision with a motor vehicle, and a significant share of these occur at intersections — the point where vehicle and cyclist paths cross most frequently. Front-end collisions account for approximately 82% of cyclist deaths in motor-vehicle crashes, indicating that the most common scenario is a vehicle striking a cyclist head-on or at an angle. Right-hook crashes (where a driver turns across a cyclist’s path) and failure-to-yield violations are the most frequently cited intersection crash types.
Alcohol Impairment
37% of fatal bicycle accidents involved a driver or cyclist operating under the influence of alcohol. This figure captures impairment on either side of the crash. Among fatally injured cyclists specifically, approximately 22% had a blood alcohol concentration (BAC) of .08 g/dL or higher. The impairment factor is explored in detail in the Alcohol Statistics section of this report.
Urbanization of Bicycle Fatalities
One of the most significant long-term shifts in bicycle safety data is the urbanization of cyclist deaths. In 1975, approximately 50% of bicyclist fatalities occurred in urban areas. By 2021, that figure had reached 86%. This dramatic shift reflects decades of suburban expansion, increased urban traffic volume, and the concentration of cycling activity on roads designed primarily for motor-vehicle throughput. As more Americans cycle in cities without protected infrastructure, urban roads have become the dominant setting for fatal bicycle crashes.
Bicycle Death Statistics by State
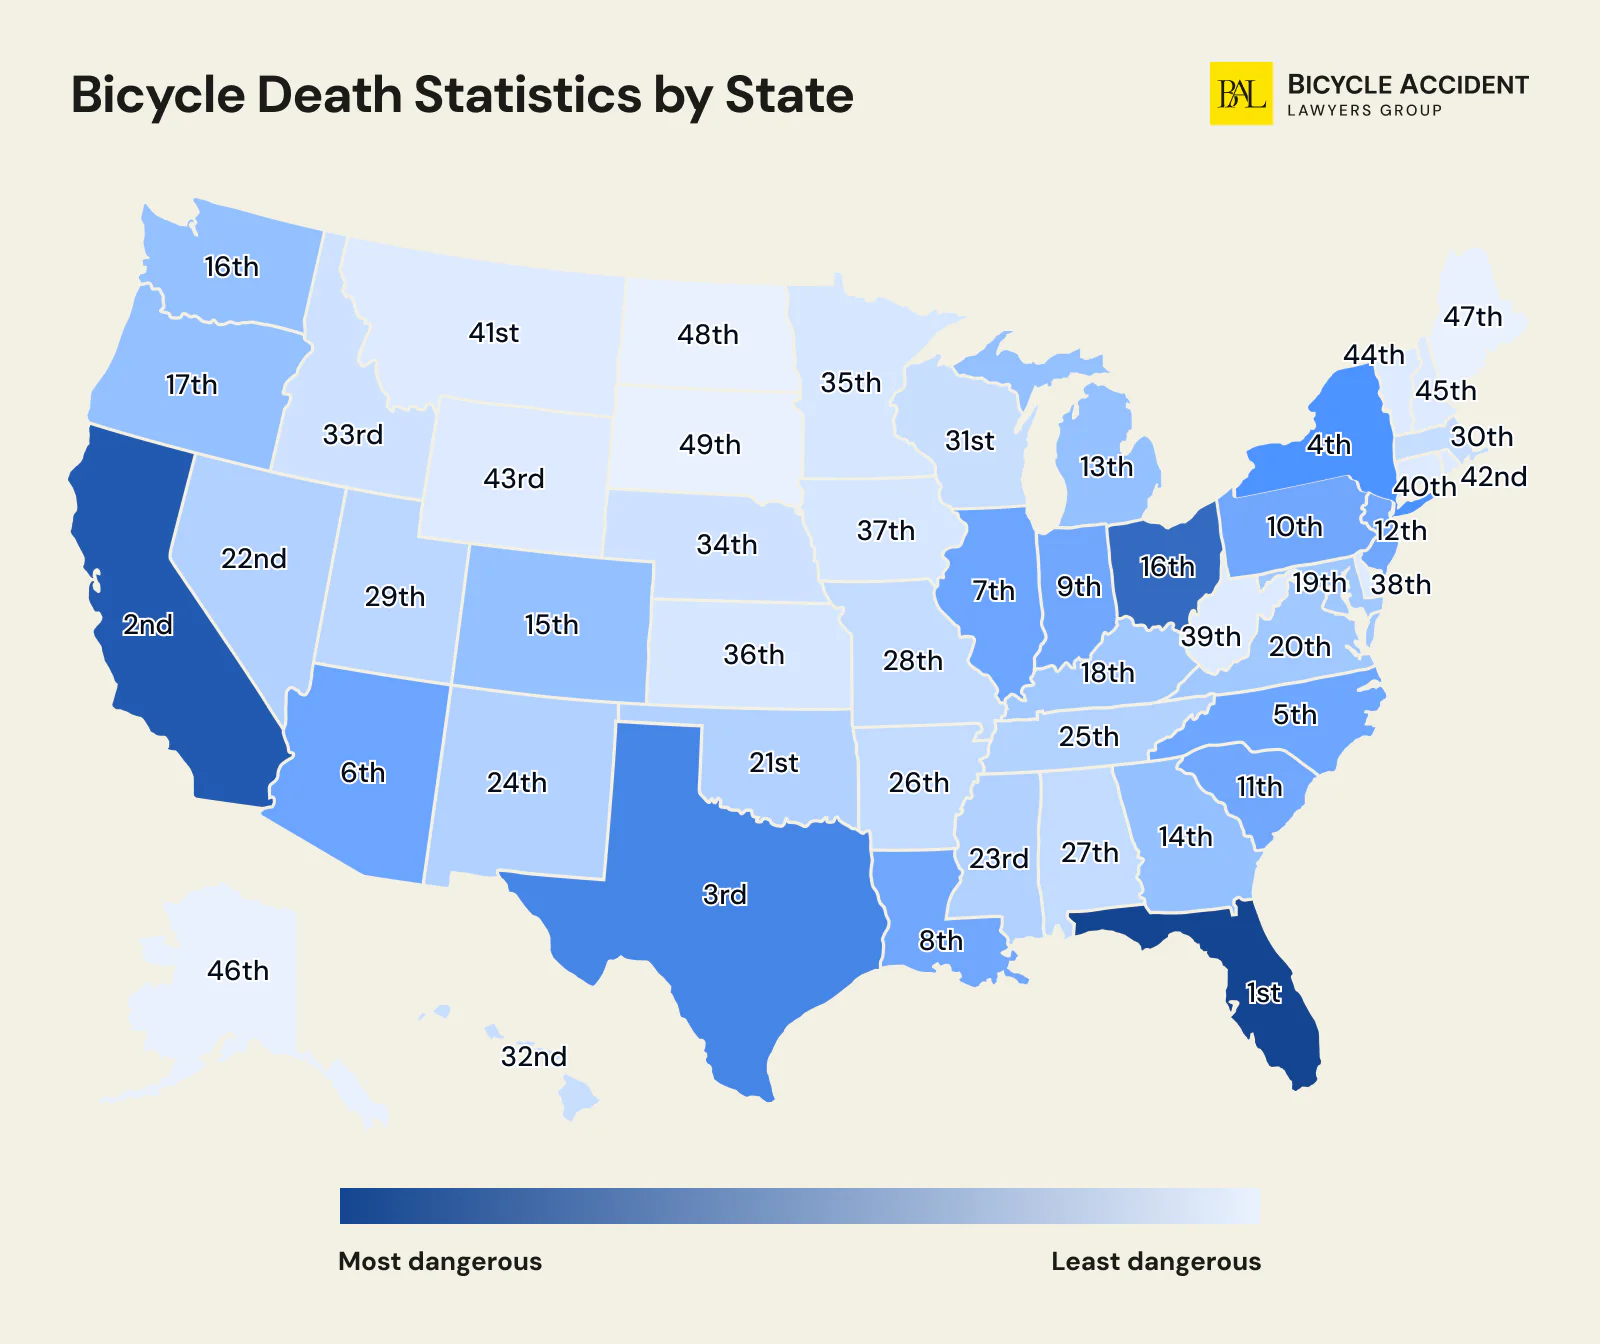
Washington, Massachusetts, and Oregon make the top 3 locations a bicyclist could dream of. However, not every state is that safe for bike riders. Nebraska, Missouri, and Mississippi are the three most dangerous states based on bike safety statistics, local approach to bike infrastructure, funding, laws, and overall support of the cycling community, according to the recent bicycle-friendly state ranking.
Interestingly enough, bicyclist-friendly actions taken by the state don’t always guarantee a low fatality rate among cyclists. Both California and Florida belong to the top 10 safe places for cycling, yet they are the two states that featured the highest fatality rates among cyclists — 145 and 234 in 2023, respectively. Between 2019 and 2023, Florida recorded a cumulative 890 bicyclist fatalities — the highest five-year total of any state — while California recorded 699 over the same period, according to the League of American Bicyclists. In California, this contrast is especially striking because the state’s fatality totals remain high despite relatively strong bike-friendly rankings, and the average settlement in California is often shaped by the severity of those crashes. At the same time, North Dakota and Montana are on the list of the most unfriendly states, yet there were 0 and 2 bicyclist casualties recorded in these states in 2023.
Although there aren’t official statistics for 2024 available at the moment, our comparative analysis indicates that the situation across the ‘deadliest’ states seems to be improving.
|
State |
2022 total |
2022 bike deaths |
2022 % |
2023 total |
2023 bike deaths |
2023 % |
2024 total |
2024 bike deaths |
2024 % |
National rank |
2022-2024 bike deaths |
|
Alabama |
988 |
14 |
1.4% |
974 |
10 |
1.0% |
962 |
10 |
1.0% |
#46 |
34 |
|
Alaska |
82 |
2 |
2.4% |
60 |
0 |
0.0% |
70 |
1 |
1.4% |
#34 |
3 |
|
Arizona |
1,302 |
50 |
3.8% |
1,304 |
43 |
3.3% |
1,229 |
44 |
3.6% |
#37 |
137 |
|
Arkansas |
643 |
6 |
0.9% |
596 |
11 |
1.8% |
603 |
4 |
0.7% |
#39 |
21 |
|
California |
4,428 |
177 |
4.0% |
4,061 |
145 |
3.6% |
3,876 |
163 |
4.2% |
#4 |
485 |
|
Colorado |
764 |
15 |
2.0% |
720 |
20 |
2.8% |
689 |
14 |
2.0% |
#6 |
49 |
|
Connecticut |
359 |
3 |
0.8% |
308 |
4 |
1.3% |
310 |
4 |
1.3% |
#13 |
11 |
|
Delaware |
162 |
6 |
3.7% |
135 |
5 |
3.7% |
126 |
5 |
4.0% |
#7 |
16 |
|
District of Columbia |
32 |
3 |
9.4% |
44 |
3 |
6.8% |
47 |
1 |
2.1% |
n/a |
7 |
|
Florida |
3,530 |
222 |
6.3% |
3,396 |
234 |
6.9% |
3,138 |
208 |
6.6% |
#8 |
664 |
|
Georgia |
1,797 |
29 |
1.6% |
1,615 |
24 |
1.5% |
1,403 |
24 |
1.7% |
#23 |
77 |
|
Hawaii |
116 |
7 |
6.0% |
93 |
8 |
8.6% |
102 |
7 |
6.9% |
#25 |
22 |
|
Idaho |
215 |
4 |
1.9% |
275 |
7 |
2.5% |
238 |
3 |
1.3% |
#36 |
14 |
|
Illinois |
1,268 |
35 |
2.8% |
1,241 |
41 |
3.3% |
1,177 |
37 |
3.1% |
#11 |
113 |
|
Indiana |
949 |
16 |
1.7% |
898 |
31 |
3.5% |
832 |
19 |
2.3% |
#20 |
66 |
|
Iowa |
338 |
4 |
1.2% |
377 |
5 |
1.3% |
356 |
4 |
1.1% |
#24 |
13 |
|
Kansas |
410 |
7 |
1.7% |
387 |
6 |
1.6% |
339 |
7 |
2.1% |
#21 |
20 |
|
Kentucky |
744 |
14 |
1.9% |
814 |
16 |
2.0% |
707 |
11 |
1.6% |
#32 |
41 |
|
Louisiana |
906 |
45 |
5.0% |
811 |
35 |
4.3% |
752 |
44 |
5.9% |
#40 |
124 |
|
Maine |
182 |
2 |
1.1% |
135 |
0 |
0.0% |
177 |
1 |
0.6% |
#28 |
3 |
|
Maryland |
564 |
10 |
1.8% |
621 |
15 |
2.4% |
578 |
11 |
1.9% |
#9 |
36 |
|
Massachusetts |
434 |
9 |
2.1% |
343 |
9 |
2.6% |
363 |
10 |
2.8% |
#2 |
28 |
|
Michigan |
1,124 |
36 |
3.2% |
1,094 |
24 |
2.2% |
1,098 |
29 |
2.6% |
#10 |
89 |
|
Minnesota |
444 |
6 |
1.4% |
409 |
6 |
1.5% |
477 |
7 |
1.5% |
#5 |
19 |
|
Mississippi |
703 |
17 |
2.4% |
732 |
13 |
1.8% |
753 |
9 |
1.2% |
#50 |
39 |
|
Missouri |
1,057 |
11 |
1.0% |
991 |
10 |
1.0% |
955 |
18 |
1.9% |
#49 |
39 |
|
Montana |
213 |
2 |
0.9% |
208 |
2 |
1.0% |
206 |
2 |
1.0% |
#43 |
6 |
|
Nebraska |
244 |
0 |
0.0% |
227 |
6 |
2.6% |
251 |
4 |
1.6% |
#48 |
10 |
|
Nevada |
416 |
15 |
3.6% |
389 |
14 |
3.6% |
417 |
15 |
3.6% |
#38 |
44 |
|
New Hampshire |
146 |
3 |
2.1% |
130 |
1 |
0.8% |
133 |
4 |
3.0% |
#31 |
8 |
|
New Jersey |
685 |
18 |
2.6% |
606 |
27 |
4.5% |
670 |
25 |
3.7% |
#26 |
70 |
|
New Mexico |
466 |
4 |
0.9% |
437 |
12 |
2.7% |
409 |
6 |
1.5% |
#35 |
22 |
|
New York |
1,175 |
50 |
4.3% |
1,114 |
49 |
4.4% |
1,101 |
47 |
4.3% |
#15 |
146 |
|
North Carolina |
1,630 |
22 |
1.3% |
1,561 |
46 |
2.9% |
1,619 |
44 |
2.7% |
#17 |
112 |
|
North Dakota |
98 |
1 |
1.0% |
106 |
0 |
0.0% |
90 |
1 |
1.1% |
#41 |
2 |
|
Ohio |
1,275 |
8 |
0.6% |
1,242 |
22 |
1.8% |
1,157 |
24 |
2.1% |
#16 |
54 |
|
Oklahoma |
710 |
15 |
2.1% |
718 |
15 |
2.1% |
645 |
11 |
1.7% |
#42 |
41 |
|
Oregon |
601 |
13 |
2.2% |
587 |
17 |
2.9% |
538 |
11 |
2.0% |
#3 |
41 |
|
Pennsylvania |
1,179 |
15 |
1.3% |
1,211 |
29 |
2.4% |
1,127 |
22 |
2.0% |
#19 |
66 |
|
Rhode Island |
52 |
0 |
0.0% |
71 |
2 |
2.8% |
52 |
5 |
9.6% |
#18 |
7 |
|
South Carolina |
1,094 |
25 |
2.3% |
1,047 |
25 |
2.4% |
1,038 |
34 |
3.3% |
#47 |
84 |
|
South Dakota |
137 |
3 |
2.2% |
140 |
0 |
0.0% |
146 |
4 |
2.7% |
#45 |
7 |
|
Tennessee |
1,314 |
15 |
1.1% |
1,323 |
11 |
0.8% |
1,197 |
9 |
0.8% |
#29 |
35 |
|
Texas |
4,408 |
91 |
2.1% |
4,291 |
106 |
2.5% |
4,160 |
79 |
1.9% |
#30 |
276 |
|
Utah |
319 |
15 |
4.7% |
280 |
9 |
3.2% |
277 |
8 |
2.9% |
#14 |
32 |
|
Vermont |
76 |
1 |
1.3% |
69 |
1 |
1.4% |
59 |
2 |
3.4% |
#22 |
4 |
|
Virginia |
1,008 |
11 |
1.1% |
913 |
15 |
1.6% |
917 |
24 |
2.6% |
#12 |
50 |
|
Washington |
733 |
11 |
1.5% |
810 |
18 |
2.2% |
730 |
13 |
1.8% |
#1 |
42 |
|
West Virginia |
264 |
2 |
0.8% |
260 |
4 |
1.5% |
256 |
5 |
2.0% |
#33 |
11 |
|
Wisconsin |
596 |
14 |
2.3% |
583 |
8 |
1.4% |
595 |
8 |
1.3% |
#27 |
30 |
|
Wyoming |
134 |
1 |
0.7% |
144 |
2 |
1.4% |
107 |
1 |
0.9% |
#44 |
4 |
|
US total |
42,514 |
1,105 |
2.6% |
40,901 |
1,166 |
2.9% |
39,254 |
1,103 |
2.8% |
3,374 |
*2024 estimates by the Bicycle Accident Lawyers Group, based on partial 2025 statistics and yearly trends. 2019–2023 totals are cumulative NHTSA FARS figures.
10 Most Dangerous States for Cyclists
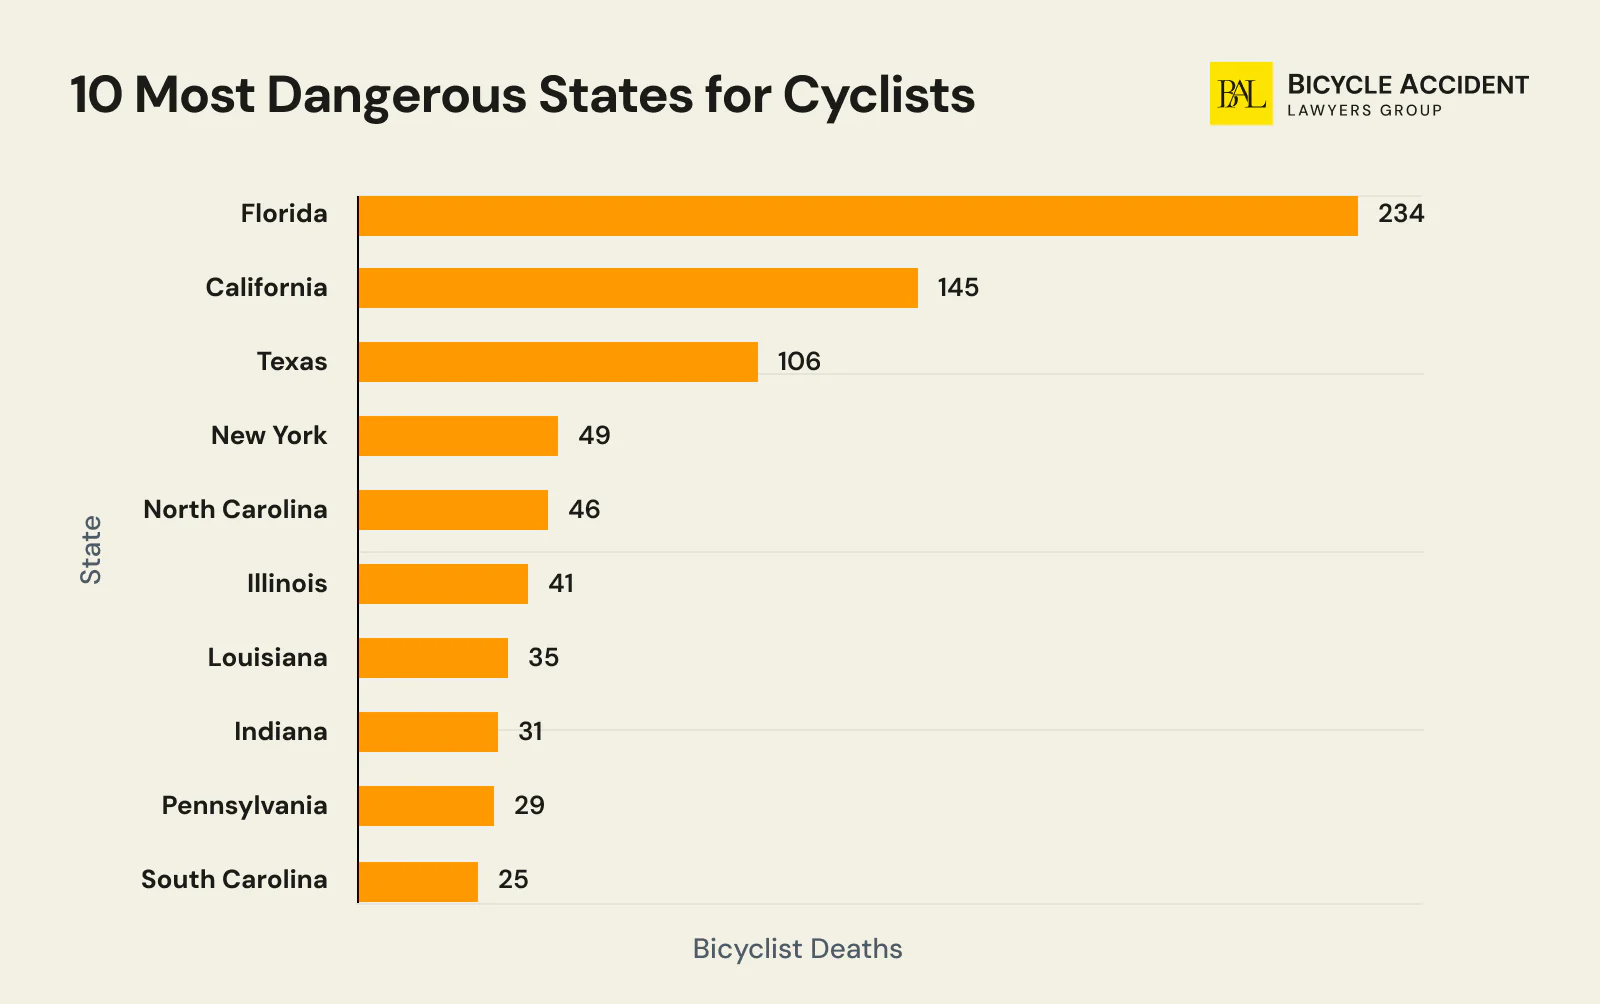
These 10 states recorded the highest bicyclist death counts and per-capita fatality rates from 2020 to 2024, measured against NHTSA FARS data and the League of American Bicyclists rankings, which score infrastructure, funding, and law rather than outcomes.
Florida
Florida leads the nation in bicyclist deaths. The state recorded 1,031 from 2020 to 2024, which is 292 more than the next state (NHTSA FARS). That works out to more than 200 deaths a year and roughly 9,000 injuries across all severity levels. The bicycle commute share is 0.5%. Florida recorded 208 cyclist deaths in 2024 alone. High-speed arterial roads with little separation between traffic and riders drive the toll, and Florida still ranked 8th for bike-friendliness that year.
California
California is one of the few large states where deaths rose in 2024, from 145 to 163. Its 2020 to 2024 total of 739 is the second-highest in the nation. Bicyclists make up more than 4% of traffic deaths statewide, well above the national 2.8%, even though nearly 70% of California motorists say bicyclists have the right to share the road.
Texas
Texas ranks third. Deaths rose 16% in 2023, from 91 to 106, then fell 25% to 79 in 2024. Texas placed 30th for bike-friendliness. Over the past 10 years it put more than 2% of its federal transportation funds into biking and walking exactly once. A large death toll and almost no infrastructure spending keep Texas in this tier.
New York
Bicyclists make up more than 4% of all traffic deaths in New York. The state reported 49 in 2023 and 47 in 2024. New York ranked 15th, helped by cities cutting speed limits to 20 and 25 mph. FHWA spending on biking and walking runs at $3.20 per capita. State law tells drivers to pass at a “safe distance” but names no minimum footage, making New York the only Northeast state without a defined passing standard.
North Carolina
Bicyclist deaths in North Carolina more than doubled between 2022 and 2023, from 22 to 46. They stayed near that level at 44 in 2024. Those deaths are close to 3% of all traffic fatalities statewide. North Carolina does put more than 2% of its federal transportation funding toward vulnerable road user safety, one of the few states in this tier to clear that benchmark.
Illinois
Illinois ranks 11th for bike-friendliness, supported by cycling businesses, universities, and a statewide trail network, yet only one-third of highway routes are suitable for bicycling. 41 riders were killed in 2023 and 37 in 2024, more than 3% of statewide traffic deaths in both years.
Louisiana
Louisiana killed 35 bicyclists in 2023, down more than 20% from the year before. The progress reversed in 2024. Deaths rose to 44, and the state posted the highest per-capita bicyclist fatality rate in the country at 0.96 per 100,000. Louisiana ranked 40th, with two bicycle-friendly communities and one bicycle-friendly business statewide. It has no approved urban speed restrictions.
Indiana
Indiana recorded 31 bicyclist deaths in 2023 and 19 in 2024. The state has no statewide bicycle safety plan, which limits coordinated investment. Children ages 10 to 14 suffer the highest injury severity of any age group in the state. Indiana has created an annual fund for sidewalk reconstruction, which may help vulnerable road users over time.
Pennsylvania
Pennsylvania ranked 19th in the Bicycle-Friendly State report, held back by slow progress on biking and walking projects. Deaths nearly doubled in 2023, from 15 to 29, then eased to 22 in 2024. Crash severity at this level shapes the average settlement in Pennsylvania in serious injury and wrongful death claims. Many municipalities have been slow to lower speed limits.
South Carolina
South Carolina killed 25 bicyclists in 2023 and 34 in 2024. The state DOT’s Pedestrian and Bicycle Safety Action Plan found that 37.6% of the fatal crashes it studied involved a motorist overtaking a rider they never saw. Charleston, Horry, Greenville, and Beaufort counties hold the worst concentration of fatal and serious-injury crashes. South Carolina ranks 47th for bike-friendliness, at 45 bicyclist deaths per 10,000 bike commuters. High speeds and few protected lanes keep it there.
10 Safest States for Cyclists
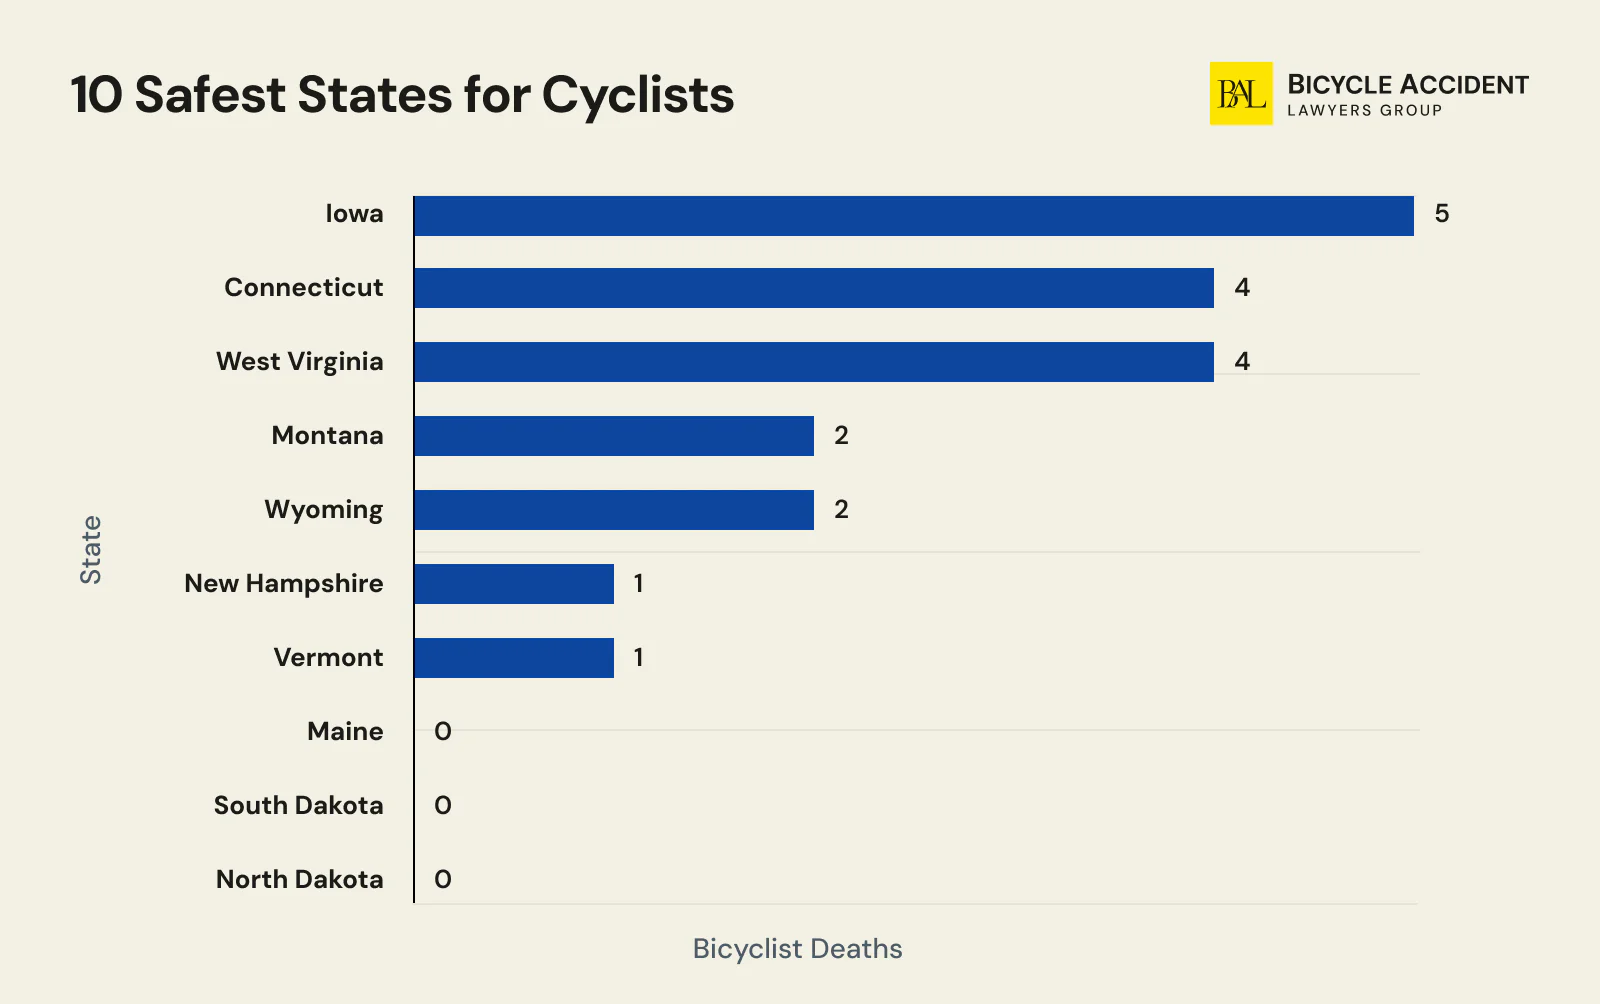
The ultimate safety of a state includes a variety of aspects. This ranges from governmental efforts and proper investment to people’s awareness of such vulnerable road user categories as cyclists. Although it may seem partially subjective, the lower the mortality rate in the area, the friendlier it appears to be.
North Dakota
North Dakota reported no pedalcyclist fatalities in 2023. Even so, the state ranked 41st in the 2024 Bicycle Friendly State Rankings. The state’s report card shows about $4.95 per capita in federal spending on biking and walking, 0.2% of commuters biking to work, and 13.5 bicyclist fatalities per 10,000 bike commuters.
South Dakota
South Dakota reported zero bicyclist fatalities in 2023. However, the state still ranked 45th nationwide in the 2024 Bicycle Friendly State Rankings, which shows that its overall cycling environment remains weak despite that single-year safety result. The state’s report card also shows about $5.17 per capita in FHWA spending on biking and walking. At the same time, South Dakota remains one of only five states that has never adopted a statewide bike plan, and the report card notes that such a plan can help guide future investments and improvements.
Maine
From 2019 to 2023, there were only 6 bicyclist deaths recorded in Maine. As of 2024, Maine holds the 28th place in the national ranking. Although the state is not among the national leaders in bicycle-friendliness, its bicyclist fatality total remained relatively low over that five-year period.
Vermont
According to recent data, only one cyclist died on Vermont roads in 2023. In fact, there is little wonder why: Vermont is one of the few states that has adopted a 4-foot safe passing rule. Moreover, local funding reached $10.79 per capita spent on walking and biking in the state. Vermont holds the 22nd national rank, although some of its safety indicators are stronger than that position may suggest.
New Hampshire
Although New Hampshire has not been deemed the safest state for cycling, it seems to be moving in the right direction. In 2023, only one rider was fatally injured on the roads of New Hampshire. That same year, the state adopted a pedestrian and bicycle plan that envisions over 2,000 miles of bikeways and more than 700 miles of trails.
Wyoming
One may assume that Wyoming’s low population density is one reason why cyclist fatality numbers remain relatively low. However, the state’s broader cycling picture is more mixed than that may suggest. Although local authorities could have spent more on cycling infrastructure, official data shows that Wyoming spent only about $2.91 per capita on biking and walking and did not reach the 2% federal funding benchmark for bike and pedestrian improvements. At the same time, the state’s report card shows a relatively strong safety figure of 1.6 bicyclist fatalities per 10,000 bike commuters.
Montana
Two fatal bike accidents were recorded across Montana in 2023. That is one of the lower cyclist fatality totals among states. Surely, the state cannot show off a dense population, but as many as 1% of Montana’s commuters use their bicycles to get to work. With that in mind, 18 communities across the state have received Safe Streets and Roads for All grants aimed at reducing traffic deaths and building safer infrastructure. Moreover, Montana State University, with support from USDOT grants, is conducting leading research on traffic safety culture and rural road safety.
West Virginia
West Virginia may not seem like an easy state for cycling, but its 2024 bicycle-friendly ranking places it 33rd nationwide. Interest in vulnerable road user safety is visible in several concrete areas. Seven communities across the state received Safe Streets and Roads for All grants aimed at reducing traffic deaths. Moreover, although West Virginia still has not reached the 2% benchmark for federal spending on biking and walking, the past two years showed a record use of federal funds on bicycling and walking projects in the state.
Connecticut
There is more than one reason why Connecticut holds 13th place in the national bicycle-friendly state ranking. Although four bicyclist deaths were reported in the state in 2023, state authorities continue to invest in programs that promote vulnerable road user safety. For instance, Connecticut launched an Active Transportation Microgrant Program that provides $5,000 grants for educational events, bike and pedestrian safety measures, and Safe Routes to School initiatives. In the first year of the program, more than $250,000 was awarded to over 60 organizations, schools, and towns.
Iowa
Iowa closes our list with a relatively low bicyclist fatality count. There were 5 bicyclist deaths recorded in 2023 in the state, which made up 1.3% of all traffic fatalities. Over the past few years, Iowa has increased federal support for bicycling and walking improvements, and the state’s 2024 report card notes greater investment through recent federal funding. The state also passed the Crosswalk Protections Bill aimed at protecting cyclists in crosswalks statewide, but it still has not adopted a safe passing law with a minimum distance of 3 feet.
Bicycle Death Statistics by City
The recent NHTSA report proves that some cities located in the most bicyclist-friendly states of America may still be quite unsafe, having a high number of cyclist deaths.
- In Sacramento, CA, bicyclist fatalities made up over 11% of all deadly crashes.
- In Los Angeles, CA, 10 cyclists were killed in an accident in 2023.
- In Charlotte, NC, Nashville, TN, and Memphis, TN, there were fewer than 1% of registered cyclists’ deaths in 2023.
- Fort Worth, TX, and El Paso, TX, had zero bike rider deaths recorded in 2023.
- Cyclist fatalities across major cities made up around 14% of all pedal cyclists’ deaths across the US in 2023.
According to our comparative analysis, the rates of cyclist deaths across the largest cities showcase an overall favorable decrease.
|
City |
2023 total |
2023 bike deaths |
2023 % |
2024 total |
2024 bike deaths |
2024 % |
Change in bike deaths |
|
Albuquerque, NM |
109 |
3 |
2.8% |
111 |
2 |
1.8% |
-1 |
|
Atlanta, GA |
84 |
1 |
1.2% |
56 |
1 |
1.8% |
0 |
|
Austin, TX |
94 |
5 |
5.3% |
100 |
3 |
3.0% |
-2 |
|
Baltimore, MD |
46 |
1 |
2.2% |
61 |
2 |
3.3% |
+1 |
|
Boston, MA |
18 |
1 |
5.6% |
27 |
1 |
3.7% |
0 |
|
Charlotte, NC |
89 |
1 |
1.1% |
113 |
4 |
3.5% |
+3 |
|
Chicago, IL |
167 |
7 |
4.2% |
167 |
4 |
2.4% |
-3 |
|
Columbus, OH |
98 |
3 |
3.1% |
66 |
3 |
4.5% |
0 |
|
Dallas, TX |
207 |
5 |
2.4% |
227 |
0 |
0.0% |
-5 |
|
Denver, CO |
76 |
2 |
2.6% |
63 |
0 |
0.0% |
-2 |
|
Detroit, MI |
131 |
3 |
2.3% |
105 |
1 |
1.0% |
-2 |
|
El Paso, TX |
84 |
0 |
0.0% |
70 |
0 |
0.0% |
0 |
|
Fort Worth, TX |
118 |
0 |
0.0% |
111 |
0 |
0.0% |
0 |
|
Fresno, CA |
52 |
1 |
1.9% |
61 |
4 |
6.6% |
+3 |
|
Houston, TX |
296 |
16 |
5.4% |
351 |
9 |
2.6% |
-7 |
|
Indianapolis, IN |
120 |
6 |
5.0% |
109 |
4 |
3.7% |
-2 |
|
Jacksonville, FL |
164 |
6 |
3.7% |
146 |
8 |
5.5% |
+2 |
|
Kansas City, MO |
98 |
3 |
3.1% |
95 |
1 |
1.1% |
-2 |
|
Las Vegas, NV |
42 |
1 |
2.4% |
58 |
2 |
3.4% |
+1 |
|
Los Angeles, CA |
329 |
10 |
3.0% |
308 |
13 |
4.2% |
+3 |
|
Louisville, KY |
118 |
4 |
3.4% |
106 |
1 |
0.9% |
-3 |
|
Memphis, TN |
244 |
2 |
0.8% |
188 |
0 |
0.0% |
-2 |
|
Mesa, AZ |
69 |
7 |
10.1% |
60 |
2 |
3.3% |
-5 |
|
Milwaukee, WI |
79 |
3 |
3.8% |
73 |
0 |
0.0% |
-3 |
|
Nashville, TN |
110 |
1 |
0.9% |
100 |
1 |
1.0% |
0 |
|
New York, NY |
204 |
22 |
10.8% |
209 |
18 |
8.6% |
-4 |
|
Oklahoma City, OK |
101 |
2 |
2.0% |
97 |
4 |
4.1% |
+2 |
|
Philadelphia, PA |
135 |
9 |
6.7% |
136 |
5 |
3.7% |
-4 |
|
Phoenix, AZ |
308 |
7 |
2.3% |
279 |
16 |
5.7% |
+9 |
|
Portland, OR |
69 |
2 |
2.9% |
60 |
3 |
5.0% |
+1 |
|
Sacramento, CA |
69 |
8 |
11.6% |
49 |
6 |
12.2% |
-2 |
|
San Antonio, TX |
178 |
8 |
4.5% |
179 |
6 |
3.4% |
-2 |
|
San Diego, CA |
94 |
2 |
2.1% |
109 |
4 |
3.7% |
+2 |
|
San Francisco, CA |
34 |
1 |
2.9% |
47 |
2 |
4.3% |
+1 |
|
San Jose, CA |
61 |
2 |
3.3% |
54 |
4 |
7.4% |
+2 |
|
Seattle, WA |
35 |
1 |
2.9% |
43 |
0 |
0.0% |
-1 |
|
Tucson, AZ |
147 |
8 |
5.4% |
143 |
8 |
5.6% |
0 |
|
Washington, DC |
44 |
3 |
6.8% |
47 |
1 |
2.1% |
-2 |
Bicycle Death Statistic by Month
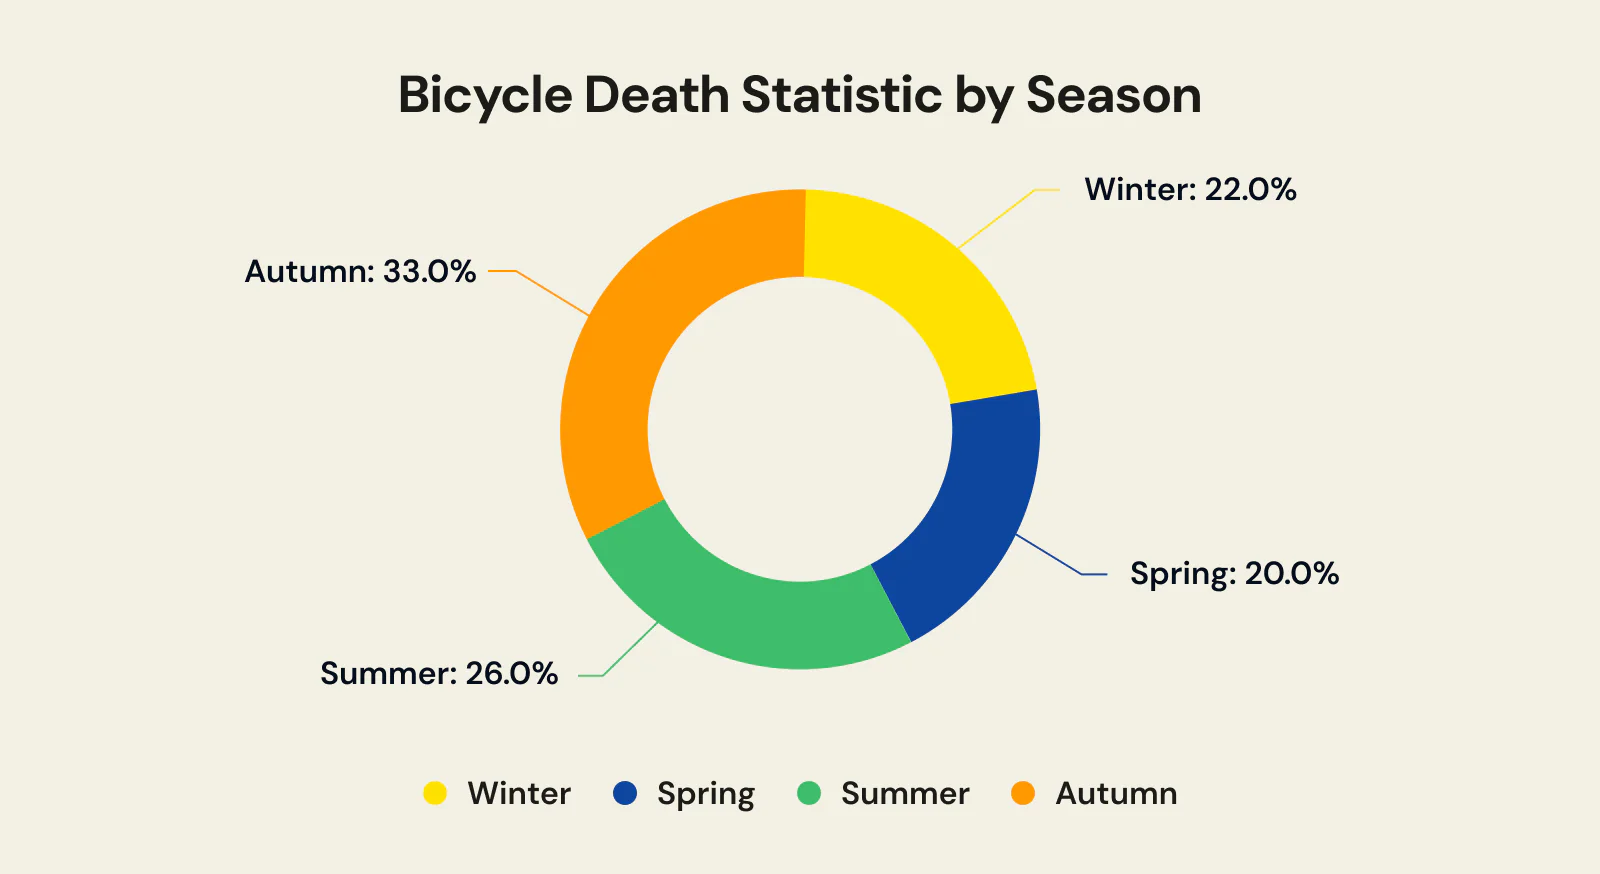
Seasonal changes have a significant impact on cyclist death counts as well. Bicycle crashes peak during the summer and fall months — July through October — which together account for nearly 43% of all cyclist fatalities in 2023. Such an alarming concentration may be explained by the increased interest in recreational cycling during these months, combined with longer daylight hours that put more riders and more vehicles on the road simultaneously.
At the same time, decreased bicyclist activity during winter and spring equals lower death rates. An in-depth comparison of seasonal fatality trends across the country shows that the trends in 2024 remain consistent with the previous year, with an approximate deviation within 1-2%.
|
Month |
2023 fatalities |
2023 % |
2024 % |
|
January |
85 |
7% |
5% |
|
February |
64 |
6% |
7% |
|
March |
73 |
6% |
7% |
|
April |
80 |
7% |
6% |
|
May |
89 |
8% |
8% |
|
June |
81 |
7% |
11% |
|
July |
129 |
11% |
9% |
|
August |
111 |
10% |
11% |
|
September |
132 |
11% |
11% |
|
October |
132 |
11% |
11% |
|
November |
92 |
8% |
9% |
|
December |
87 |
8% |
6% |
|
Total |
1,155 |
Bicycle Death Statistic by Time
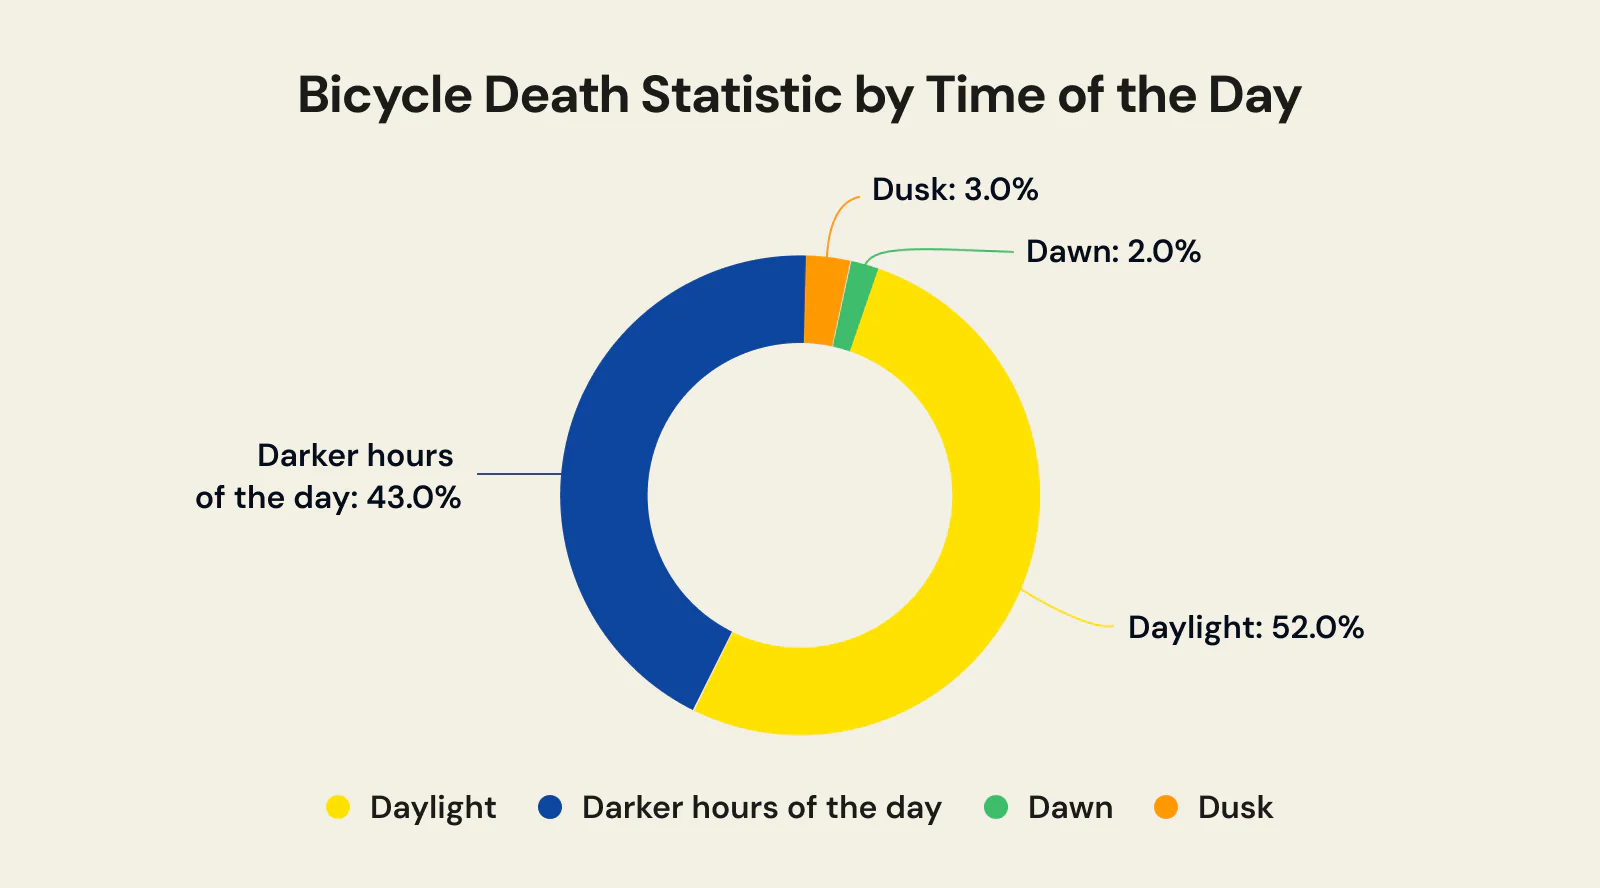
According to the recent reports from the National Highway Traffic Safety Administration (NHTSA), most cyclist deaths occurred in broad daylight. However, when dusk, dawn, and darker hours are combined, they account for over 56% of all bicyclist fatalities — making reduced-visibility conditions the dominant factor in fatal crashes by time of day. The 2024 forecast reflects similar trends, with barely noticeable shifts toward darker hours of the day — 43% as opposed to 41.6% for dark-only. Even such an insignificant change in dark-time fatality rate may emphasize the pressing need for improvement of lighting infrastructure throughout the country.
|
Light condition |
2023, % |
2024, % |
|
Daylight |
42% |
44% |
|
Dark |
53% |
52% |
|
Dusk |
3% |
3% |
|
Dawn |
2% |
1% |
|
Combined dusk + dawn + dark |
58% |
56% |
Note: The National Safety Council reports that 56% of bicyclist fatalities occur at dusk, dawn, or during nighttime, using a broader classification methodology that captures additional twilight-hour incidents.
Bicycle Death Statistic by Location Type
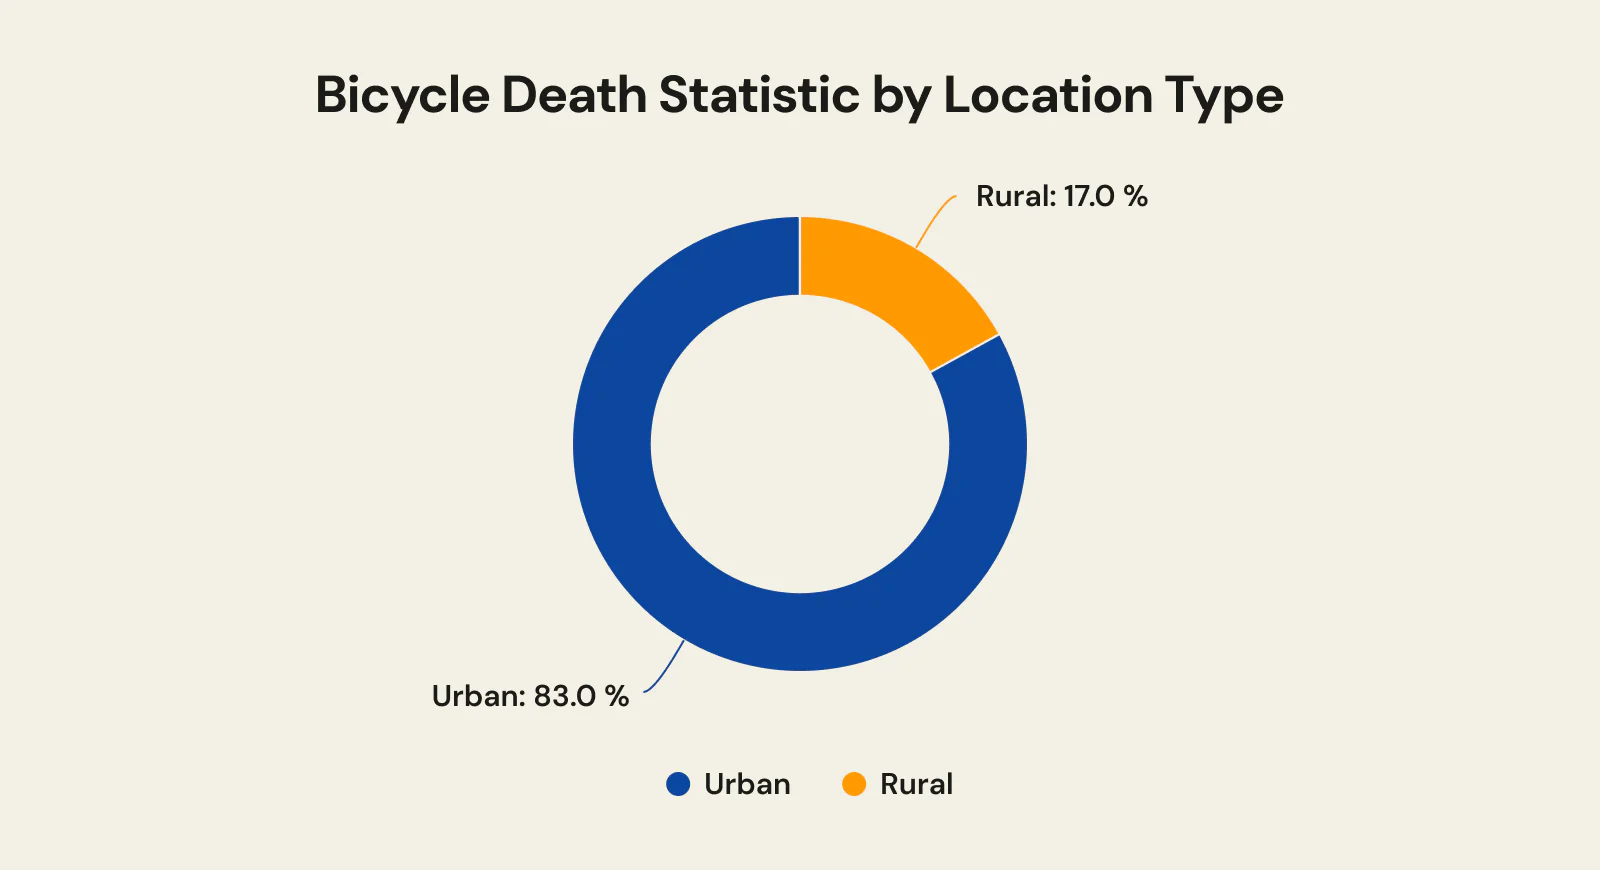
Back in the day, there was little difference as to whether the accident happened in urban or rural areas; the stats were primarily equal, around 50%. However, nowadays, the data tells a different story:
- 85% of bicyclist fatalities occurred in urban areas in 2021 — up dramatically from approximately 50% in 1975, reflecting decades of suburban expansion and the concentration of cycling on high-traffic urban arterials.
- 19% of bicyclist injuries were deadly in rural bicycle accidents.
- Urban bicyclist deaths have grown from roughly half of all cyclist fatalities in 1975 to more than four-fifths in recent data, marking a major long-term shift in bicycle safety patterns.
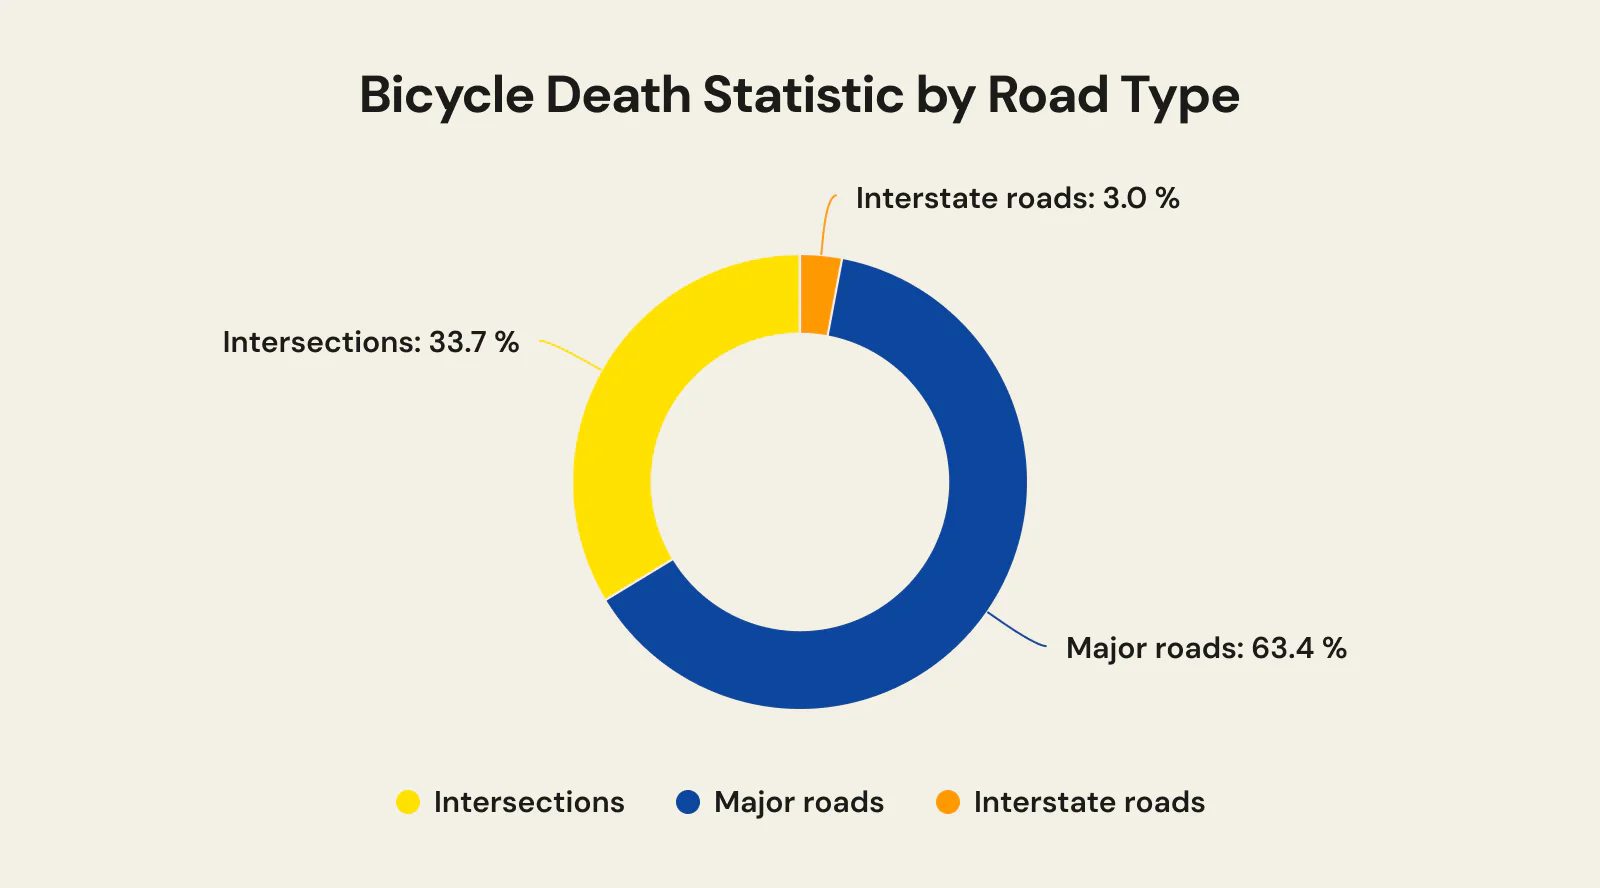
The fact that the vast majority of cyclists die within city limits does not mean that every part of a city is equally dangerous. Some locations pose a greater threat to bicyclists and pedestrians. According to the 2023 data:
- 750 cyclists lost their lives on major roads.
- 347 people were fatally injured while riding bikes on minor roads.
- 44 bike riders died on interstates and freeways.
|
Type of Road |
2023, % |
2024, % |
|
Interstates |
4% |
3% |
|
Major roads |
65% |
66% |
|
Minor roads |
30% |
29% |
Bicycle Death Statistic by Age and Sex
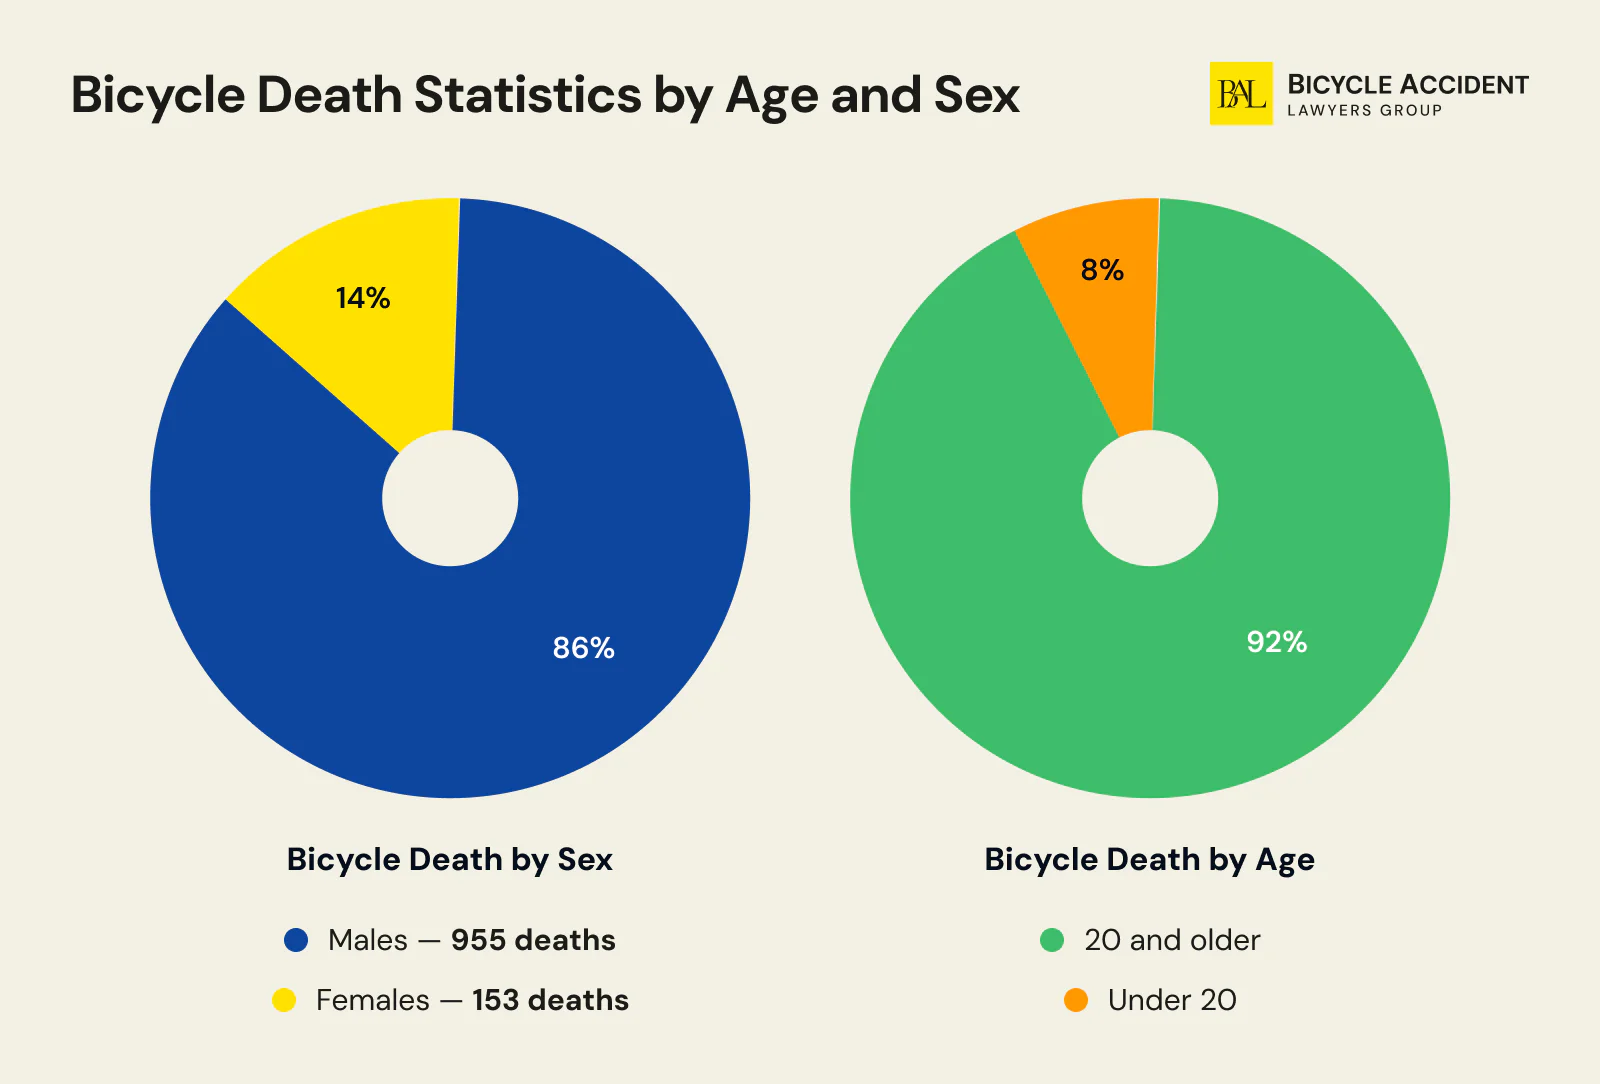
Age and sex play a major part in the bicyclist fatality rate. According to the National Safety Council and NHTSA data, males account for approximately 89% of all bicycle deaths nationwide. Among specific age groups, adults aged 55–69 and adolescents aged 10–14 face the highest risk of fatal bicycle crashes.
- Males account for approximately 89% of all bicycle deaths, including both motor-vehicle and non-motor-vehicle incidents (NSC).
- In motor-vehicle-involved crashes specifically, 79–80% of fatally injured cyclists were male adults aged 20 and older (NHTSA).
- Female riders’ deaths dropped by 1% in 2023, but made up 12% of all bicyclists killed nationwide in 2024.
- Fatalities among younger cyclists remain consistently low, rarely exceeding 10% for males and 2% for females.
- Adults aged 55–69 have the highest bicycle death rates of any age group, driven by reduced bone density, longer recovery times, and greater vulnerability to traumatic brain injury.
- Adolescents aged 10–14 represent the second-highest risk group, likely reflecting increased independent cycling during school commute and recreation.
Our current analytical insights state that new cycling safety strategies that prioritize adult riders, especially those over 55, have to be implemented.
|
Year |
<20 years Male |
% |
<20 years Female |
% |
≥20 years Male |
% |
≥20 years Female |
% |
Total |
|
2023 |
64 |
6% |
24 |
2% |
920 |
79% |
115 |
10% |
1,163 |
|
2024 |
79 |
7% |
18 |
2% |
851 |
79% |
106 |
10% |
1,075 |
Note: NHTSA FARS data above covers motor-vehicle-involved deaths only. When all bicycle-related deaths are included (NSC methodology), males account for approximately 89% of the total.
Bicycle Nonfatal Injury Statistics
While fatality data tends to dominate the headlines, the scale of nonfatal bicycle injuries in the United States is far larger. According to CDC WISQARS and the National Safety Council, roughly 341,774 people suffered nonfatal bicycle-related injuries in 2023. This includes emergency department visits from both motor-vehicle crashes and non-motor-vehicle incidents such as falls, mechanical failures, and collisions with fixed objects.
Despite the high absolute number, nonfatal bicycle injuries have actually decreased by approximately 29% since 2014, according to NSC data. This decline may reflect improvements in bicycle design, road surface quality, and rider awareness — though it could also be partially explained by changes in injury reporting and ED visit patterns.
Key nonfatal injury facts:
- Roughly 341,774 nonfatal bicycle injuries were recorded in 2023 (NSC/CDC).
- This represents a 29% decrease compared to 2014 levels.
- The most common nonfatal injuries include fractures, contusions, lacerations, and traumatic brain injuries.
- Medical costs for bicycle-related injuries totaled approximately $3.1 billion in 2023, with average work loss costs reaching around $18,000 per incident.
- Children aged 10–14 experience the highest rate of nonfatal bicycle injuries requiring emergency department treatment.
Bicycle Death Statistic by Helmet Use
There are no federal laws stating that every bicyclist must wear a protective helmet while riding their bike. In the majority of states, children between 14 and 17 years must wear helmets every time they ride, but most of the rules do not apply to adults, except in cases where local ordinances state otherwise.
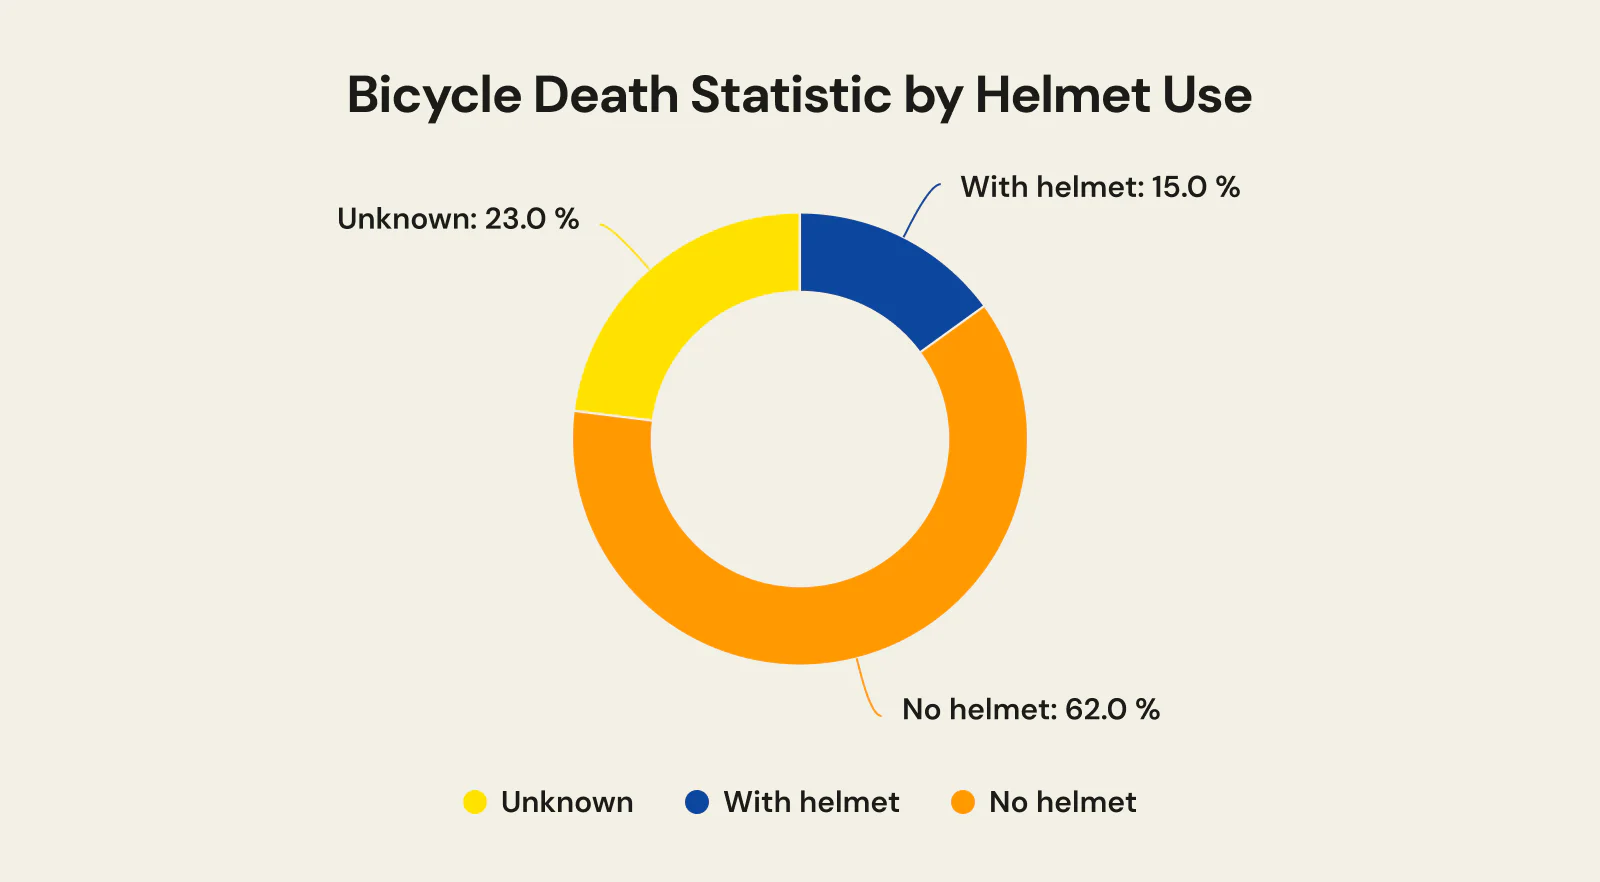
- 14% of cyclists were wearing a protective helmet at the time of a deadly incident in 2023.
- Over 62% of fatally injured bike riders weren’t wearing protective helmets.
- 50% of severe head injuries that a cyclist may sustain happen due to the absence of a protective helmet.
- 21% of males are prone to wear a helmet.
- 28% of female riders wear helmets.
Bicycle helmets reduce the risk of severe head injuries in a crash, which is why this factor is a key safety metric in the data above. Our 2024 forecast reflects consistent fatality rate patterns, which suggest that stronger public awareness campaigns, stricter helmet law enforcement, and community-based safety programs are required to improve these cyclist fatality trends.
|
Helmet use |
2021, % |
2022, % |
2023, % |
2024, % |
|
With helmet |
15% |
15% |
15% |
13% |
|
No helmet |
62% |
62% |
65% |
68% |
|
Unknown |
24% |
22% |
21% |
19% |
Bicycle Death with Alcohol in Blood Statistics
Most of the states in America have an approved blood alcohol concentration threshold that every vehicle user has to abide by. It is illegal to drive with a BAC of .08 g/dL and over everywhere else except for Utah. In Utah, the threshold was decreased to .05 g/dL.
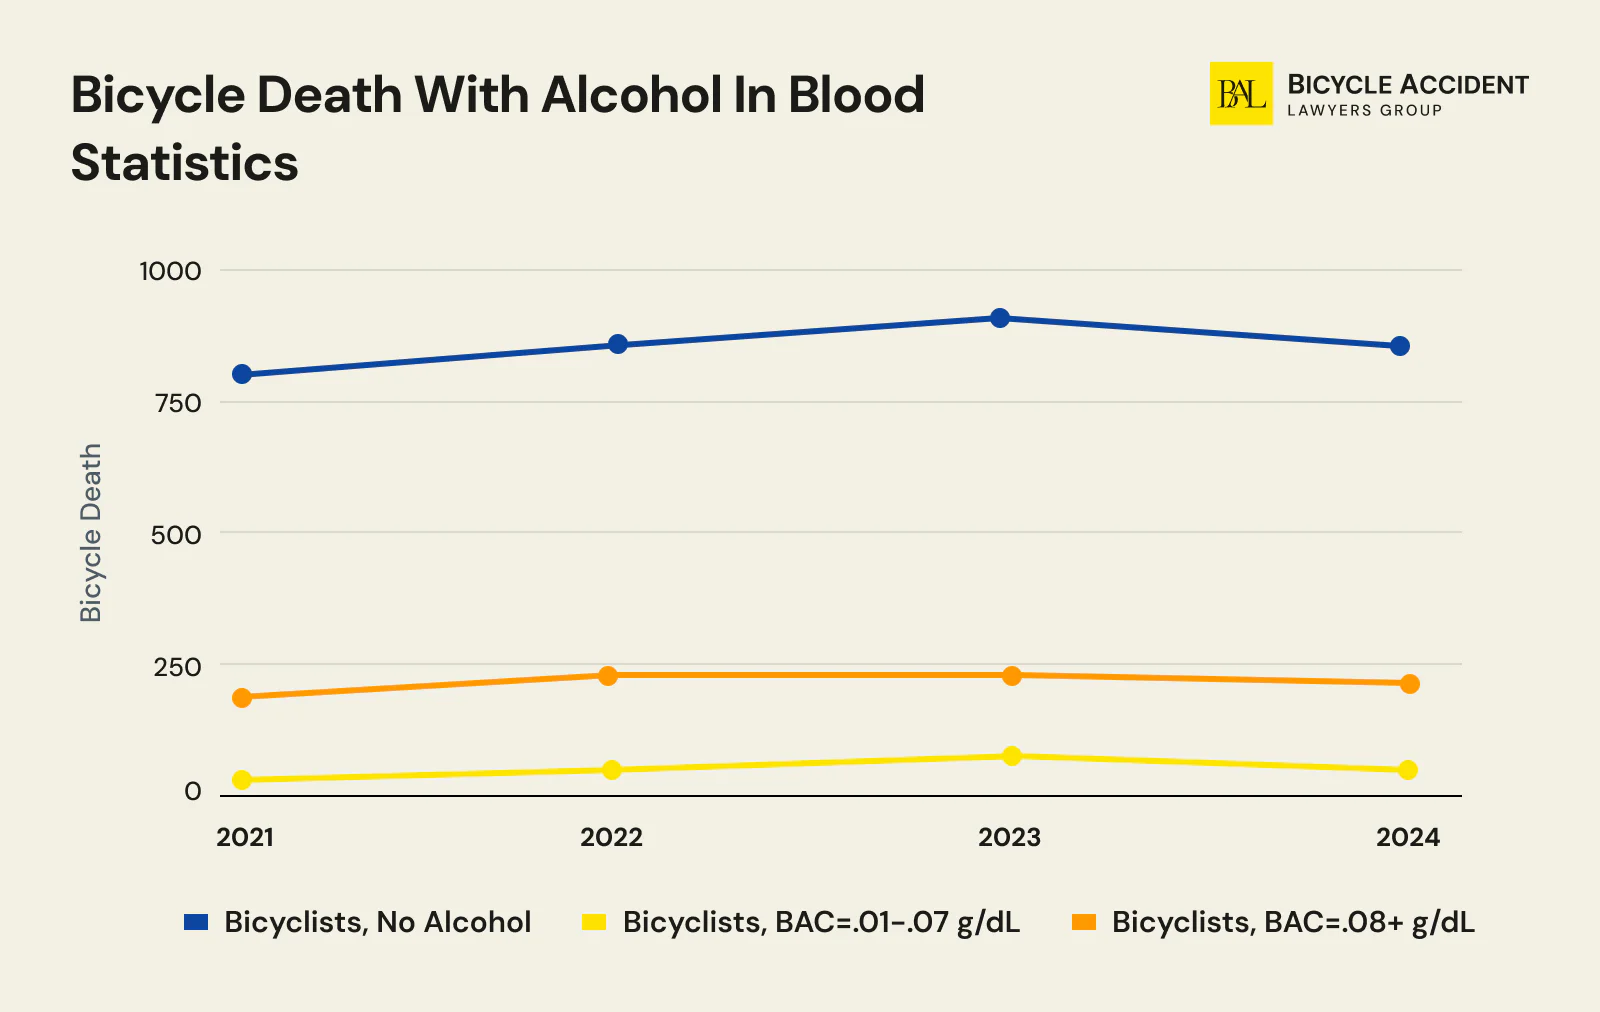
Overall, 37% of fatal bicycle accidents involved a driver or cyclist operating under the influence of alcohol. This combined figure captures impairment on either side of the crash. When looking at cyclist impairment specifically:
- Over 78% of fatal bike accidents involved a sober cyclist in 2023.
- Around 18% of fatally injured bicyclists had a BAC of .08 g/dL detected in their system.
- 3% of deadly collisions involved an impaired driver and an impaired bicyclist.
- The overall percentage of intoxicated bike riders was over 22% in 2023.
Our 2024 predictive analysis indicates that the percentage of impaired bikers on the streets dropped by at least 1%.
|
Bicyclists’ condition |
2021 |
2022 |
2023 |
2024 |
|
Bicyclists, no alcohol |
766 |
849 |
910 |
874 |
|
Bicyclists, BAC=.01-.07 g/dL |
24 |
33 |
39 |
43 |
|
Bicyclists, BAC=.08+ g/dL |
175 |
215 |
213 |
184 |
|
% of cyclists with BAC .08+ |
18% |
20% |
18% |
17% |
|
Total fatal crashes |
965 |
1,097 |
1,162 |
1,101 |
Bicycle Death Statistics by Point of Impact
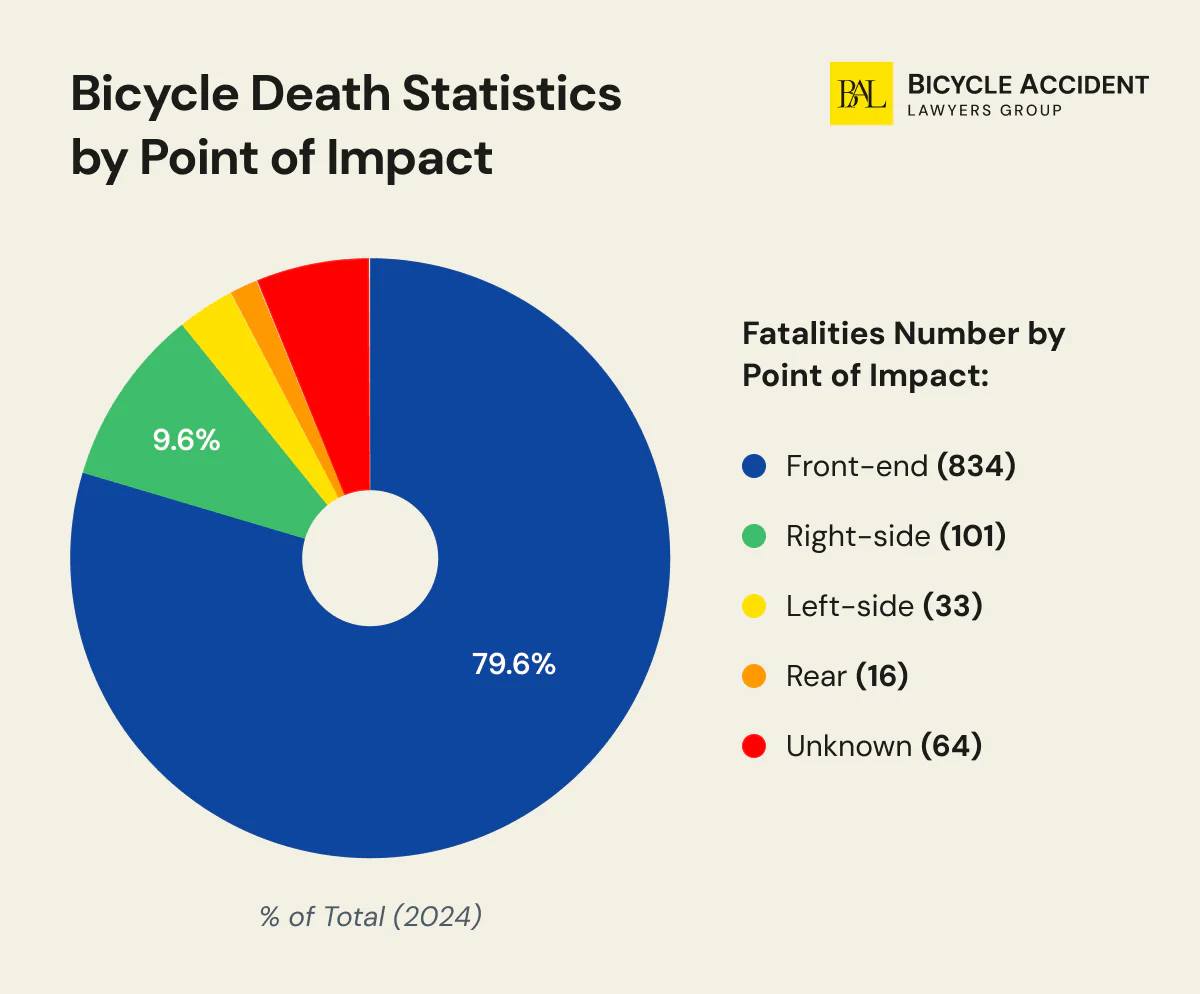
According to the most recent data, on average, 283 bike riders were killed in hit-and-run collisions, and 3% of bicyclists were fatally injured by distracted drivers. By type of vehicle crashes, the data reflects the following trends:
- Around 82% of cyclists died in front-end collisions.
- 7.9% of right-side crashes between bicyclists and other motorists resulted in a fatal outcome.
- 2.5% of left-side collisions were deadly to pedal cyclists.
- 1.3% of rear-end bicycle crashes had lethal outcomes.
|
Point of impact |
2021 |
2022 |
2023 |
2024 |
|
Front-end |
756 |
853 |
898 |
869 |
|
Left-side |
19 |
28 |
27 |
16 |
|
Right-side |
52 |
64 |
86 |
66 |
|
Rear |
11 |
14 |
14 |
15 |
|
Unknown |
74 |
76 |
66 |
69 |
|
Total |
912 |
1,035 |
1,091 |
1,035 |
Bicycle Death Statistics by Vehicle Type
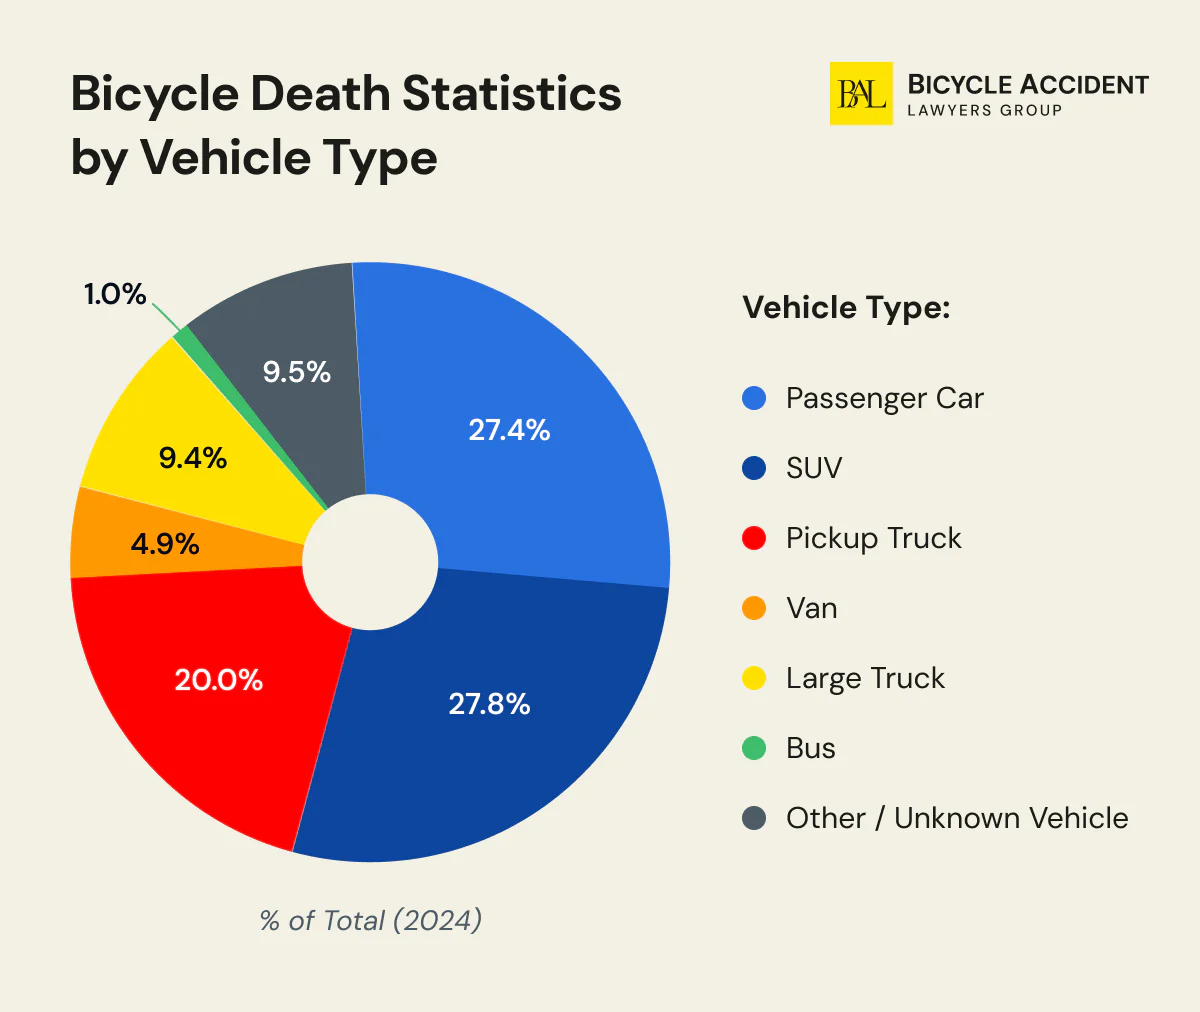
Every car poses a danger to an average bicyclist. The size, speed, and force of impact brought upon a cyclist often lead to fatal injuries. According to the recent data from NHTSA, buses are the least dangerous of all the vehicles on the streets in terms of bicyclists’ safety.
- 323 bicyclists were killed by drivers of passenger cars in 2023.
- SUVs are the second most dangerous vehicle; 288 cyclists died from collisions with SUVs in 2023.
- Pickups and large trucks held the third and fourth places when it came to deadly bicycle accidents.
- 11 bike riders died in 2023 from bus collisions.
|
Vehicle type |
2021 |
2022 |
2023 |
2024 |
|
Passenger car |
316 |
320 |
323 |
282 |
|
SUV |
204 |
248 |
288 |
292 |
|
Pickup |
180 |
214 |
216 |
220 |
|
Van |
37 |
37 |
53 |
40 |
|
Large truck |
65 |
107 |
89 |
89 |
|
Bus |
6 |
5 |
11 |
8 |
|
Other/unknown vehicle |
104 |
104 |
111 |
104 |
|
Total |
912 |
1,035 |
1,091 |
1,035 |
Effective Ways to Decrease Bicyclist Fatality Rates in the USA
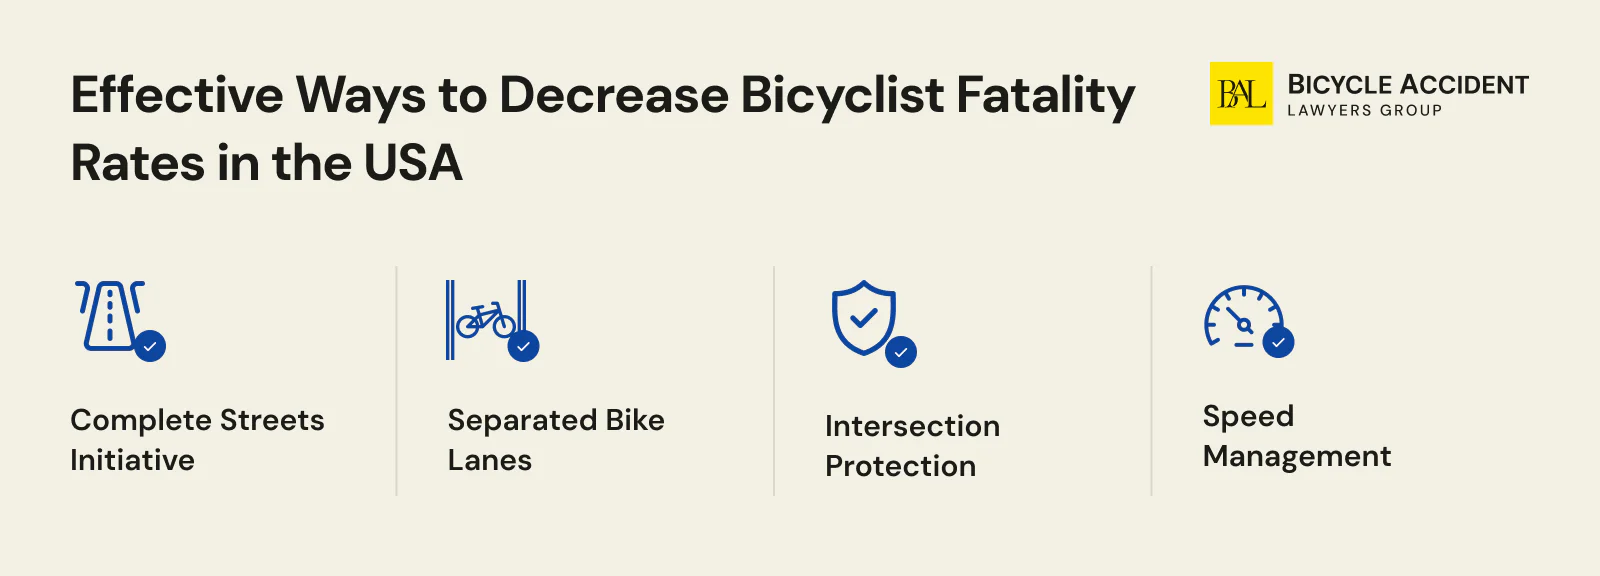
Pedal cyclists make a critical part of the vulnerable road users category and usually can’t stand a chance against a speeding vehicle. However, there are a few things that the Department of Transportation can do to improve the overall safety of this group and support injury prevention. These initiatives focus on safety measures that can reduce fatal crashes.
Complete Streets Initiative
The Complete Streets project aims to improve the overall street infrastructure across the country to make it equally safe and accessible for everyone – improving driver, cyclist, and pedestrian safety. These changes don’t just help cyclists – they are also designed to reduce pedestrian deaths by making crossings, speed and stop signs more visible. This project often includes protected bike lanes to separate cyclists from motor vehicle traffic.
Separated Bike Lanes
Driving side-by-side with larger vehicles always poses a significant threat; no matter how law-abiding a driver or a cyclist is, driver inattention can lead to fatal crashes. Separated or protected bike lanes can decrease accident rates, saving and protecting hundreds of lives nationwide.
Intersection Protection
With more than 30% of bicyclist deaths taking place at intersections, safety improvements in those parts of the street would be a wise decision. Implementation of bicycle boxes, signal faces, and protected bike lanes and intersections is a few upgrades that the authorities could take to protect the cycling community.
Speed Management
A motor vehicle driving at 40 mph increases the chances of a bicyclist being fatally injured by 11 times. Once the speed goes up to 50 mph, the likelihood spikes to 16 times. That is why lowering speed limits is critical to reducing cyclist deaths.
Conclusion
Although in 2023, cycling fatalities grew by 4%, the 2024 forecast reflects a positive decrease of almost 5% in the bicycle riders’ death rate, alongside other shifts and changes. Surely, it does not mean that cyclists don’t have to be careful about where and when they ride.
Yet, as the biking communities have expanded in recent years across the country, it becomes easier to raise awareness about the most pressing matters and inspire local communities to take necessary measures to promote bicyclist safety. A well-thought-out combination of infrastructure changes, public education, traffic laws, and other meaningful initiatives can help reduce bike and motor vehicle traffic crashes and ensure that a 2024-2025 downward trend in cyclist rates of fatal injuries becomes a norm, not an exception!
Methodology and Data Sources
The statistics in this report are drawn from multiple authoritative sources. Because each source uses different reporting criteria, classification methods, and time frames, figures may vary between them:
- National Safety Council (NSC) — Provides the broadest count of bicyclist fatalities, including both motor-vehicle and non-motor-vehicle deaths (falls, mechanical failures, collisions with fixed objects, etc.). The NSC’s 2023 total of 1,377 bicyclist deaths is the figure used in our “At a Glance” summary as the headline death toll.
- NHTSA Fatality Analysis Reporting System (FARS) — The federal census of all traffic fatalities on U.S. public roads involving motor vehicles. FARS recorded 1,166 pedalcyclist fatalities in 2023. This is the primary source for our year-over-year fatality trend table and state-by-state breakdown.
- CDC WISQARS (Web-based Injury Statistics Query and Reporting System) — Provides national estimates of nonfatal injuries (including emergency department visits), medical costs, and work loss costs. The 341,774 nonfatal injury figure and the $3.1 billion medical cost estimate are sourced from WISQARS.
- U.S. Census Bureau, American Community Survey (ACS) — Provides bicycle commuter population estimates used for per-capita fatality rate calculations.
- League of American Bicyclists — Source for the Bicycle Friendly State rankings and five-year cumulative state fatality totals.
- CPSC NEISS (National Electronic Injury Surveillance System) — Provides additional injury surveillance data, particularly for product-related bicycle incidents.
We completed our 2024 predictive analysis for bicyclist death rates based on a variety of underlying factors and conditions using the linear regression trend comparison approach. Our experts explored historical data from official traffic safety reports and came up with an approximate forecast. The statistical assumptions presented by the Bicycle Accident Lawyers Group rely on consistent patterns and do not take into account possible changes that occurred during the underreported period.
There’s room for statistical inconsistency due to information acquired from various publicly available resources.

Robert Goldwater is a cyclist representing cyclists. He has practiced personal injury and wrongful death law for more than 20 years, graduating with Honors from Arizona State University Law School, and has helped recover over $1 billion for clients, including injured cyclists.