

In 2023, 1,155 bicyclists were killed in traffic crashes in the United States, the highest recorded number and an 86% increase from the 2010 low point. Cyclists account for just 1% of all trips, yet they represent 2–3% of all motor-vehicle-related deaths. Most fatal bicycle crashes occur in urban areas, at non-intersection locations, and increasingly involve light trucks such as SUVs and pickups.
Cyclists share the road with about 285 million registered motor vehicles in the United States. More than 1,000 bicyclists were killed nationwide in 2023, while total motor vehicle crash deaths remained near 39,345.
Car vs. bicycle accident statistics help show where fatal crashes happen most often, which road users face the highest risk, and which traffic conditions make bicycle collisions more dangerous. At Bicycle Accident Lawyers Group, we believe clear and accessible crash data help riders better understand risk and make safer decisions on the road.
- Key Car vs. Bicycle Accident Statistics
- Bicycle vs Car Accident Statistics Over the Past Decade
- Bicycle vs Car Accident Statistics by Cause
- Car vs Bicycle Accidents at Intersections and Non-Intersection Locations
- Car vs Bicycle Accidents by Vehicle Type
- The Effect of the Area Type on Car vs Bicycle Accidents
- Car vs Bicycle Accidents by Age
- Bicycle vs Car Accident Statistics by Gender
- Helmet Use and Head Injury in Car vs Bicycle Crashes
- Monthly Trends in Car vs Bicycle Accident Statistics
- Bicycle Accident Statistics by Time of Day
- Fatalities in Traffic Accidents by Light Condition
- Weather-Related Traffic Accident Statistics
- Bike vs Car Accident Statistics by Speeding Involvement
- Health Benefits vs. Crash Risk for Cyclists
- What to Do After a Car Accident with a Bicycle?
- Who Is at Fault for Car Versus Bicycle Accidents?
- Conclusion
- Helpful Resources
- Get a FREE case evaluation today
Key Car vs. Bicycle Accident Statistics
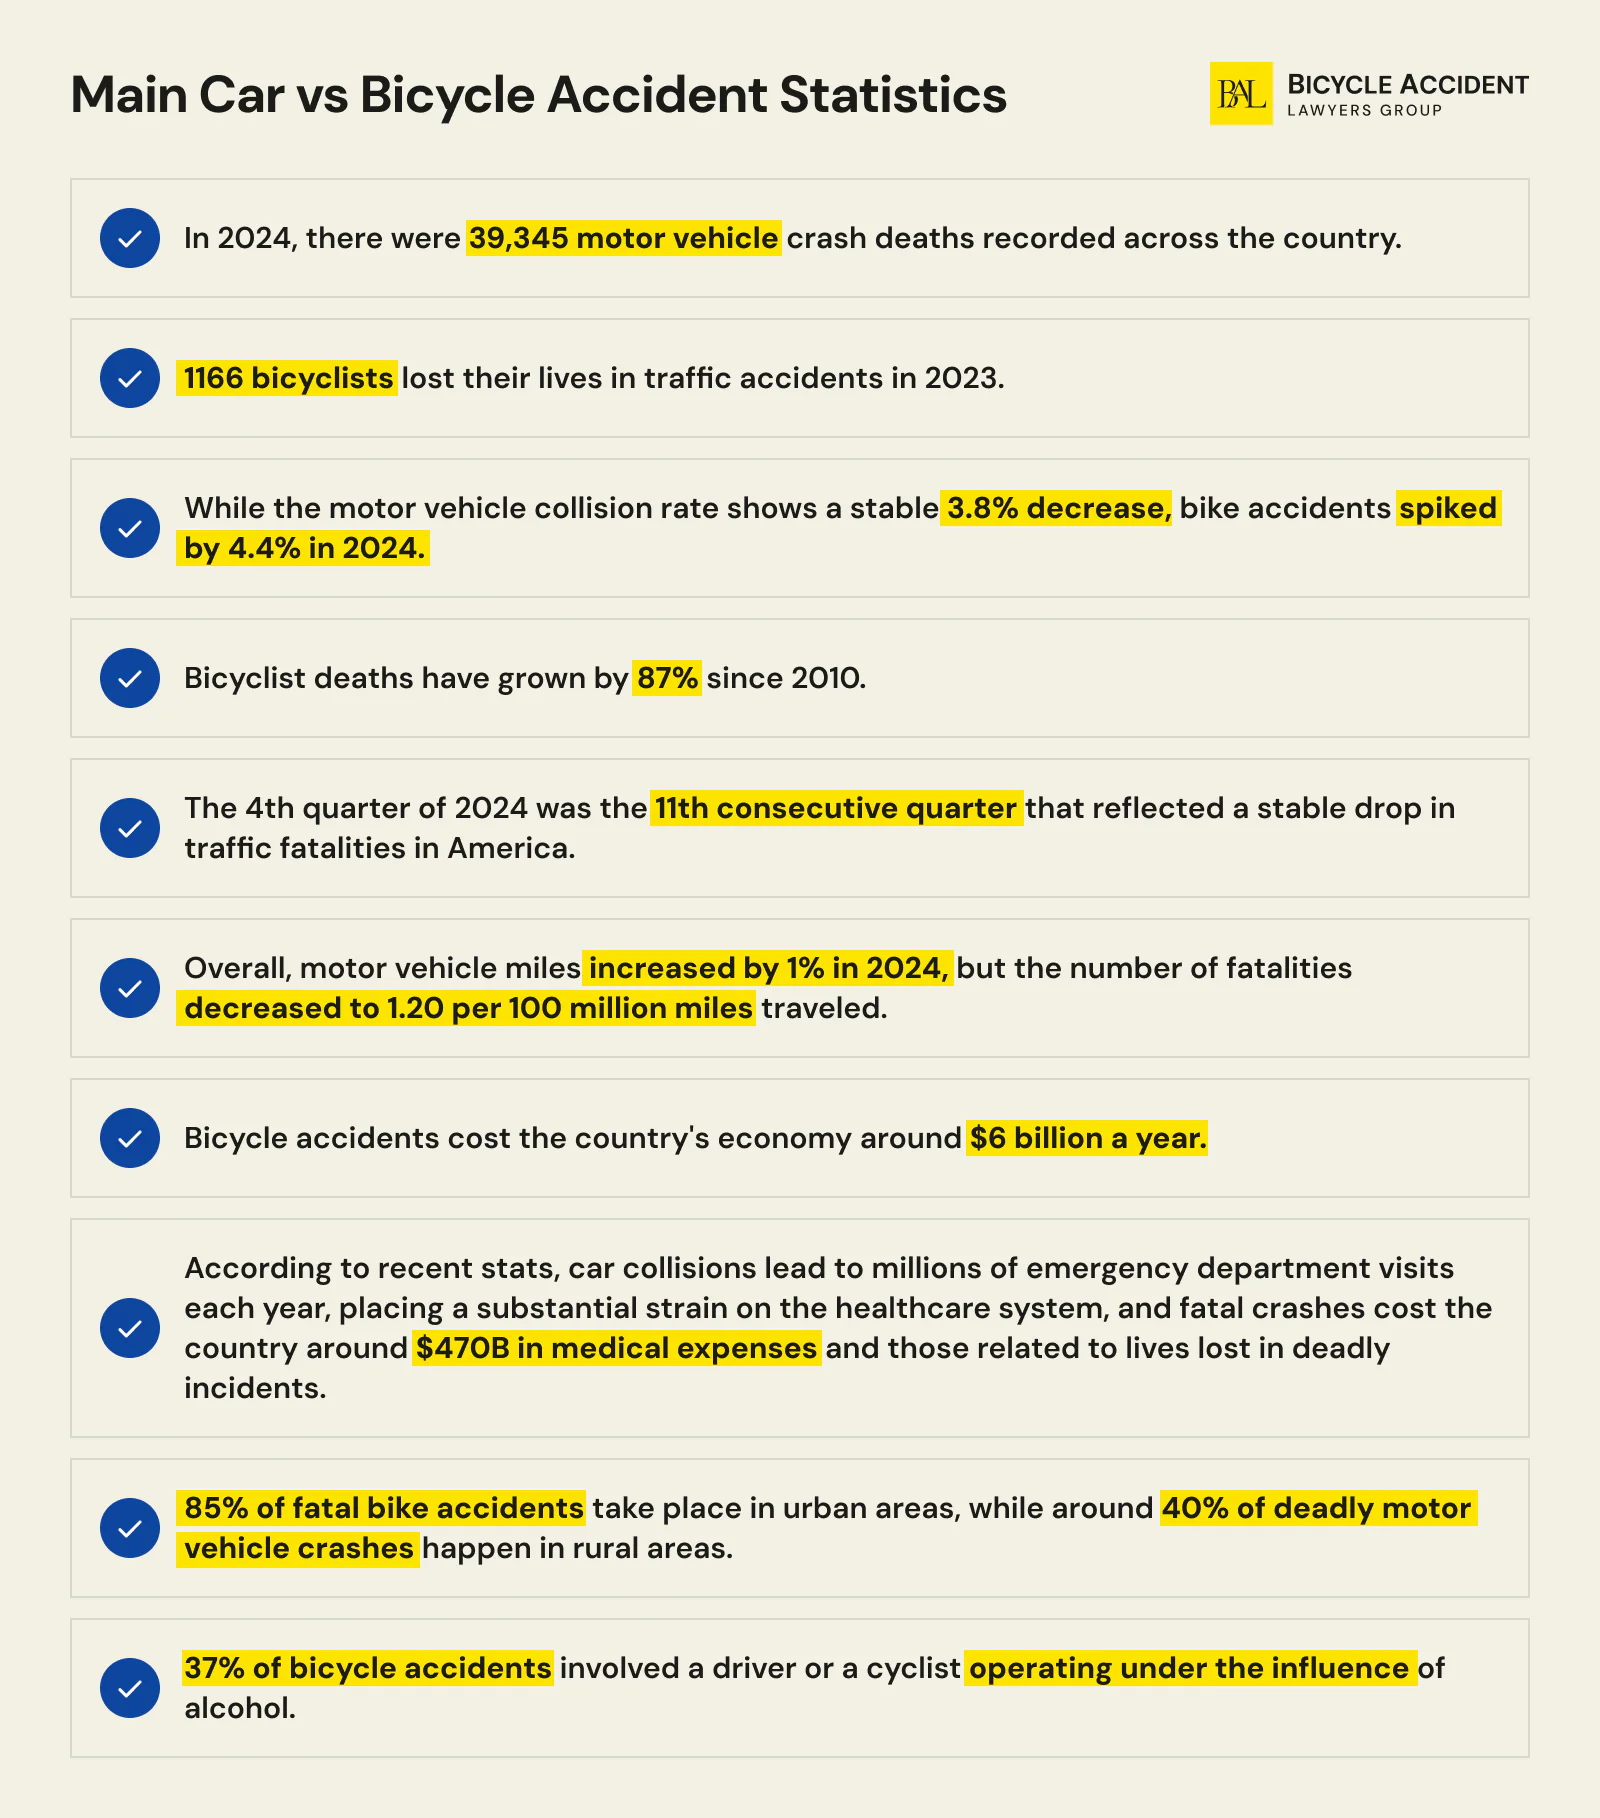
- In 2024, the United States recorded 39,345 motor vehicle crash deaths.
- In 2023, 1,166 bicyclists were killed in traffic crashes. IIHS reports 1,155 under a slightly different classification.
- Bicyclist deaths have increased by about 86% since 2010.
- Overall traffic fatalities fell by 3.8% in 2024. The fourth quarter of 2024 marked the 11th straight quarterly decline.
- Vehicle miles traveled increased by about 1% in 2024, while the fatality rate fell to 1.20 deaths per 100 million miles traveled.
Risk Disparity
- Cyclists account for approximately 1% of all U.S. trips but make up 2-3% of all motor-vehicle-related fatalities.
- Cyclists are approximately twice as likely to be hospitalized after a crash compared to motor vehicle occupants, reflecting the fundamental protection asymmetry between a bicycle and a car.
Injury and Economic Burden
- About 45,000 to 50,000 cyclists are injured in motor-vehicle traffic crashes each year.
- In 2023, cyclist injuries reached 49,989.
- Some estimates place the annual economic cost of bicycle accidents at about $6 billion.
- Fatal crashes are associated with losses of about $470 billion, and car crashes lead to millions of emergency department visits each year.
Where Fatal Crashes Happen
- Approximately 85% of fatal bicycle crashes occur in urban areas, while about 40% of deadly motor vehicle crashes happen in rural areas.
- 62% of fatal car-vs-bicycle crashes occur at non-intersection locations, where cyclists are exposed to overtaking vehicles and high-speed traffic.
Contributing Factors
- Some summaries attribute about 37% of bicycle accidents to alcohol involvement by the cyclist or driver.
- SUVs, pickups, and vans account for about 46% of fatal car-vs-bicycle crashes.
Bicycle vs Car Accident Statistics Over the Past Decade
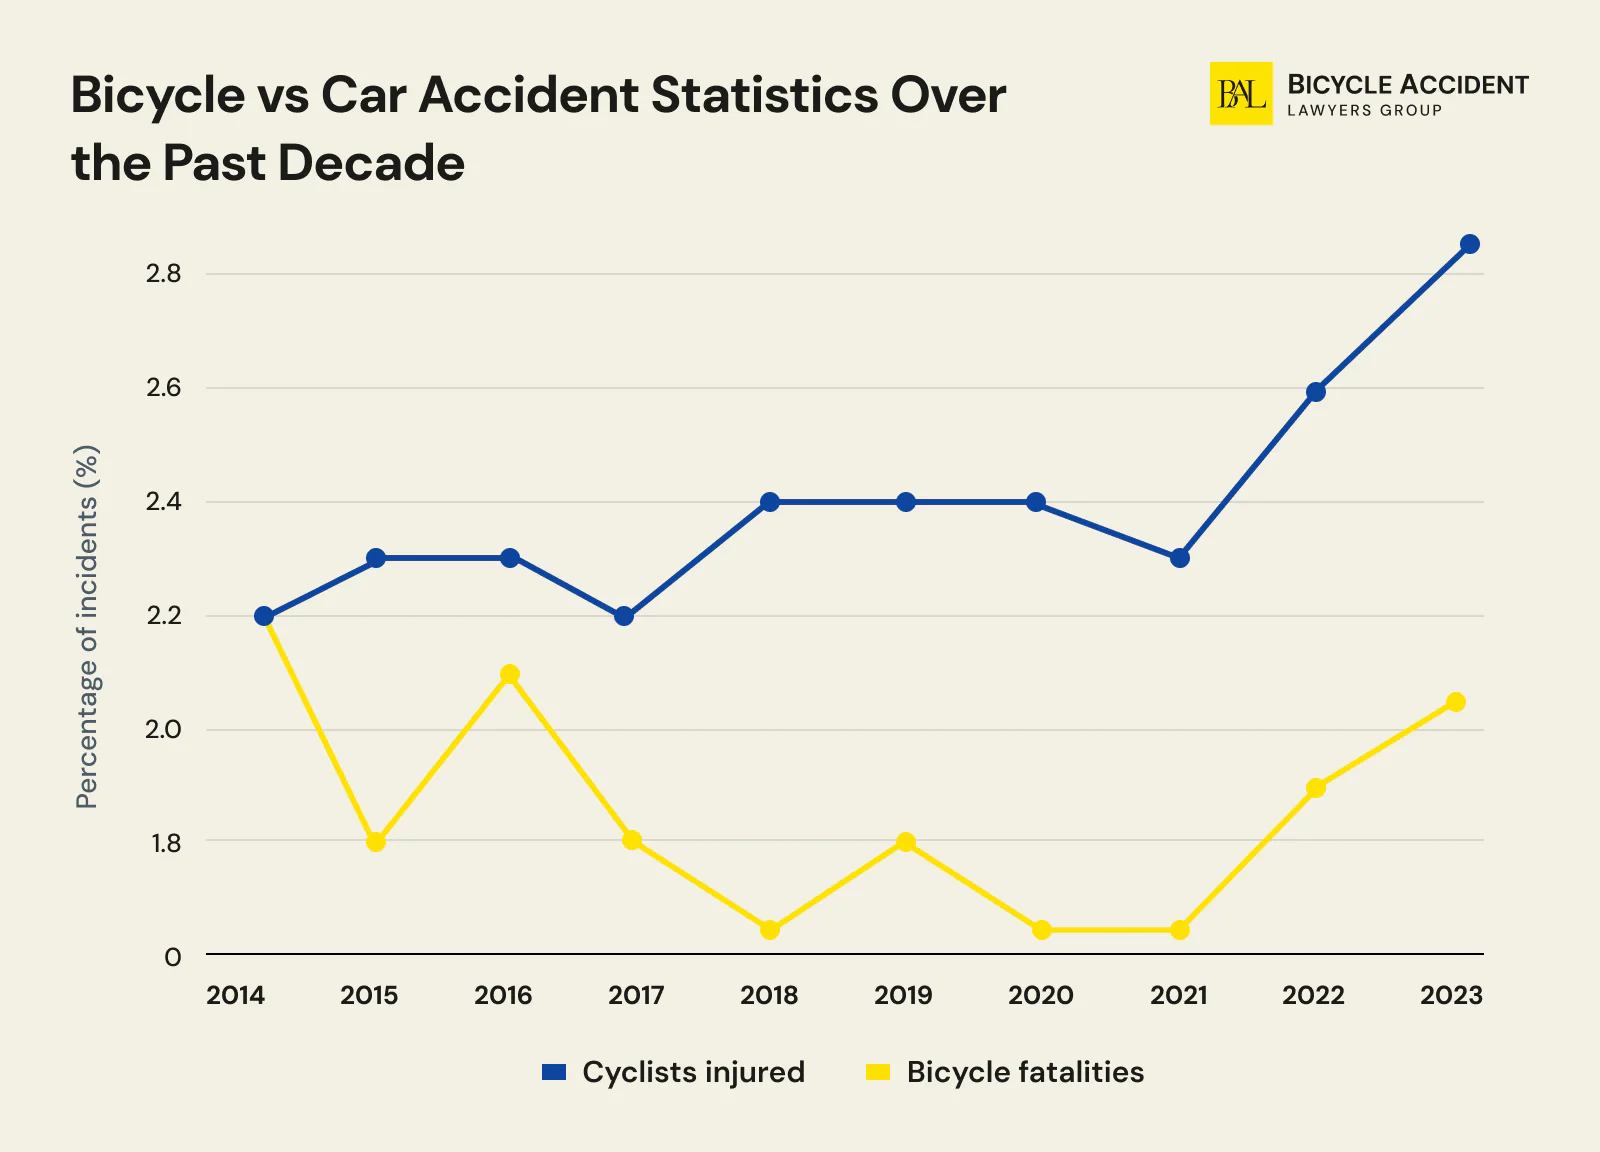
Over the past decade, research has shown that overall traffic fatalities recorded across the United States have exhibited evident fluctuations. At the same time, the cyclist fatality rate shows a steady increase, which should raise obvious concern:
- In ten years, fatal bicycle accidents grew by around 60%.
- From 2014, deadly cyclist crashes increased by nearly 60%.
- Bicycle-related injuries peaked in 2016 but seem to have been in a stable decline since then.
- While child bicyclist fatalities (under 20) have declined over the past two decades, adult cyclist deaths have risen sharply, with fatalities among riders aged 20 and older increasing nearly fivefold since 1975, according to IIHS data.
|
Year |
Total fatalities |
Number of fatal bicycle accidents |
% |
Total injured |
Number of cyclists injured |
% |
|
2014 |
32,744 |
729 |
2.20% |
2,342,621 |
50,414 |
2.20% |
|
2015 |
35,484 |
829 |
2.30% |
2,454,778 |
45,066 |
1.80% |
|
2016 |
37,806 |
853 |
2.30% |
3,061,885 |
64,218 |
2.10% |
|
2017 |
37,473 |
806 |
2.20% |
2,745,268 |
49,698 |
1.80% |
|
2018 |
36,835 |
871 |
2.40% |
2,710,059 |
46,536 |
1.70% |
|
2019 |
36,355 |
859 |
2.40% |
2,740,141 |
49,057 |
1.80% |
|
2020 |
39,007 |
948 |
2.40% |
2,282,209 |
38,886 |
1.70% |
|
2021 |
43,230 |
976 |
2.30% |
2,497,869 |
41,615 |
1.70% |
|
2022 |
42,514 |
1,105 |
2.60% |
2,382,771 |
46,195 |
1.90% |
|
2023 |
40,901 |
1,166 |
2.85% |
2,442,581 |
49,989 |
2.05% |
Decade-long traffic safety observations and the collected data reveal an alarming trend for cyclists, especially in urban areas where infrastructure hasn’t kept pace with increasing bike traffic. Increased urban cycling, the absence of protected bike lanes, and inadequate driver behavior may be among the major factors contributing to these statistics.
Bicycle vs Car Accident Statistics by Cause

Many bike accidents remain underreported across the country, especially if they do not involve serious or fatal traumas. However, when severe injuries are involved, California bicycle accident settlements may reflect the long-term medical, financial, and emotional losses that follow these collisions. Considering that cars contribute to almost 70% of cyclist fatalities, let’s review some of the most frequent causes of such incidents.
|
Cause |
% |
|
Dooring |
10%-20% |
|
11% |
|
|
10% |
|
|
30% |
While some stats look relatively insignificant, we find it necessary to paint a larger picture:
- Distracted drivers triggered 3,275 fatal accidents in 2023.
- The use of a cell phone while driving led to around 12% of traffic accidents.
- Over 600 vulnerable road users, including cyclists, were killed by a distracted driver in 2022.
- The largest age group of distracted drivers is in their mid-20s to mid-30s.
- Over 12K people died because of alcohol-impaired drivers.
- On average, 34 people are killed by a drunk vehicle operator in America on a daily basis.
- On a slightly brighter note, it’s safe to assume that speeding-related accidents are on the decline, as a 4.3% decrease was recorded in 2023.
Car vs Bicycle Accidents at Intersections and Non-Intersection Locations
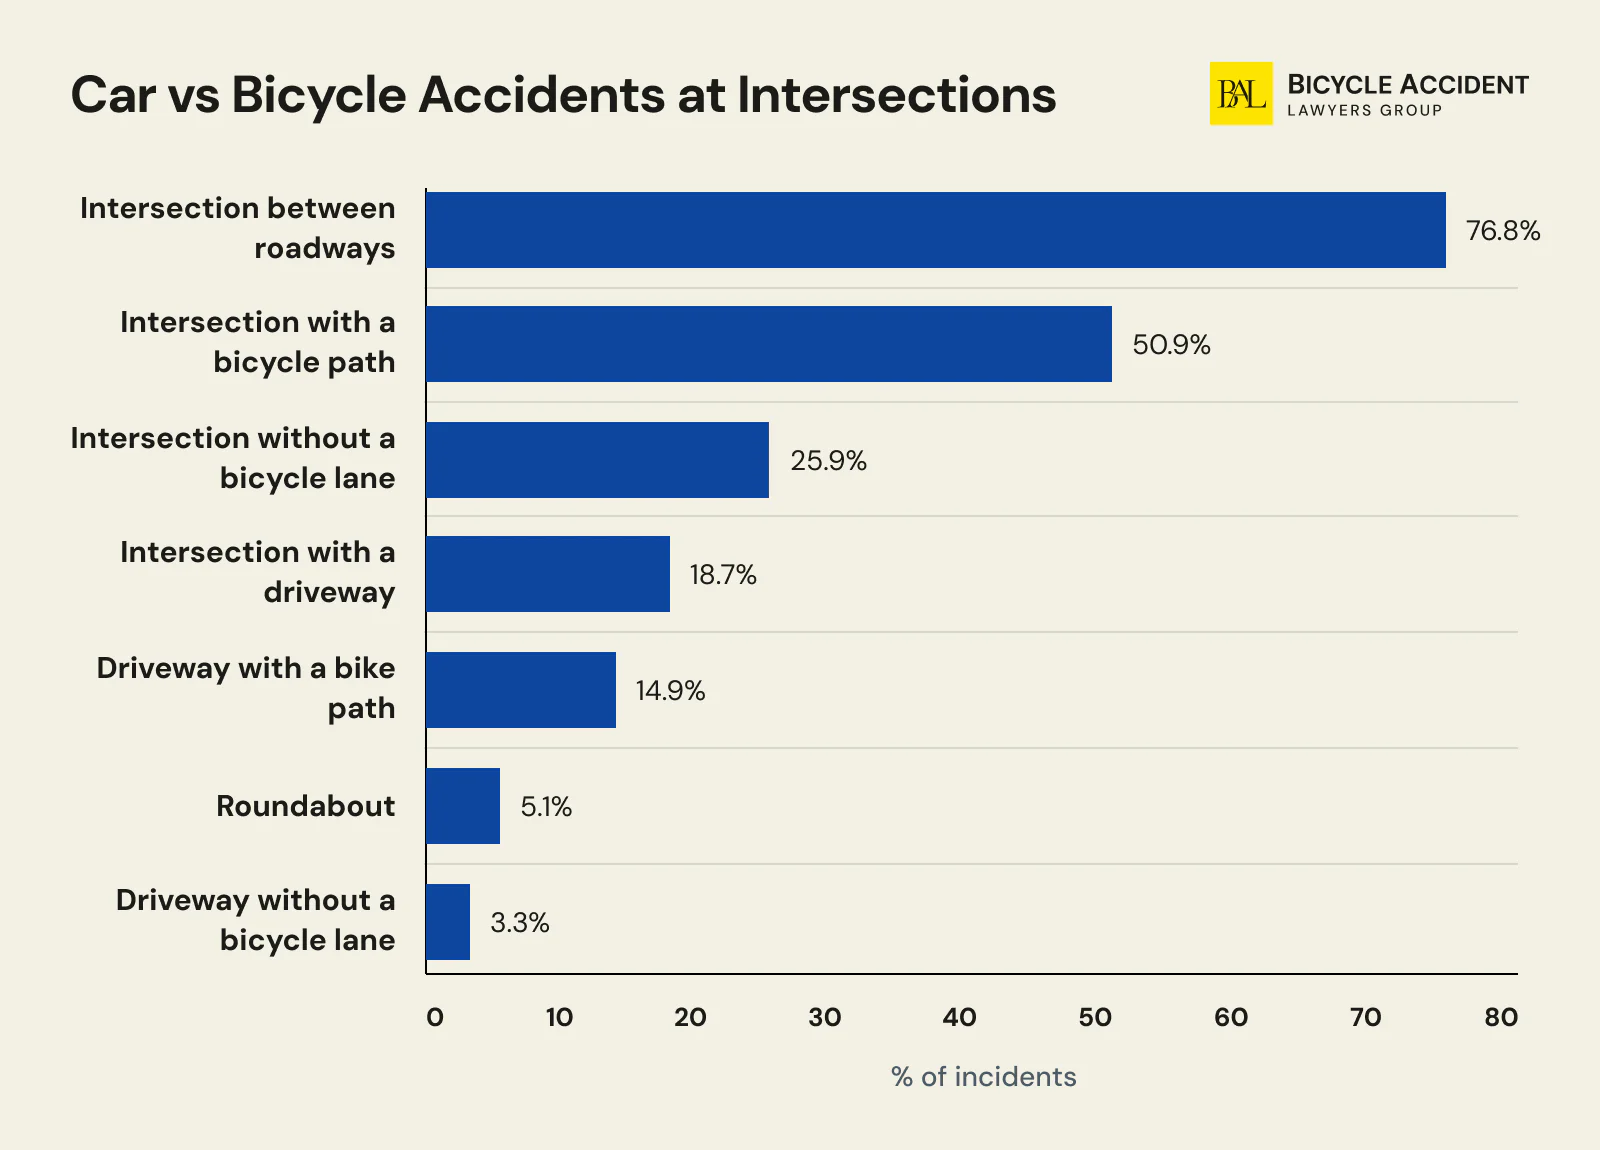
While intersections are often viewed as the most dangerous spots for cyclists, the data tells a more nuanced story. According to IIHS, 62% of fatal car-vs-bicycle crashes actually occur at non-intersection locations: mid-block segments, driveways, and other points where cyclists are exposed to overtaking vehicles, high-speed traffic, and limited sight lines. This makes non-intersection locations the dominant setting for the most severe car-vs-bicycle crashes in the United States.
That said, intersections still present a significant threat to this road user category. Let’s take a closer look at the distribution of intersection collisions involving bicyclists and motor vehicles.
|
Type of intersection |
% of incidents |
|
Intersection between roadways |
76.8% |
|
Intersection with a bicycle path |
50.9% |
|
Intersection without a bicycle lane |
25.9% |
|
Intersection with a driveway |
18.7% |
|
Driveway with a bike path |
14.9% |
|
Roundabout |
5.1% |
|
Driveway without a bicycle lane |
3.3% |
Most Common Types of Bicycle Collisions at an Intersection
There are a few potentially dangerous maneuvers that can lead to serious bicycle crashes at intersections:
- Right hook: A car cuts the rider off when turning right at the intersection.
- Left cross: A vehicle hits a cyclist who rides straight while the driver decides to make a left turn.
- Dooring: A car door suddenly opens at the corner of an intersection and throws the biker off.
- Side swipe: A motor vehicle tries to overtake the bicyclist while in a shared or designated lane.
- Drive-out: A car pulls out of a driveway without inspecting the road or failing to notice the rider.
Car vs Bicycle Accidents by Vehicle Type
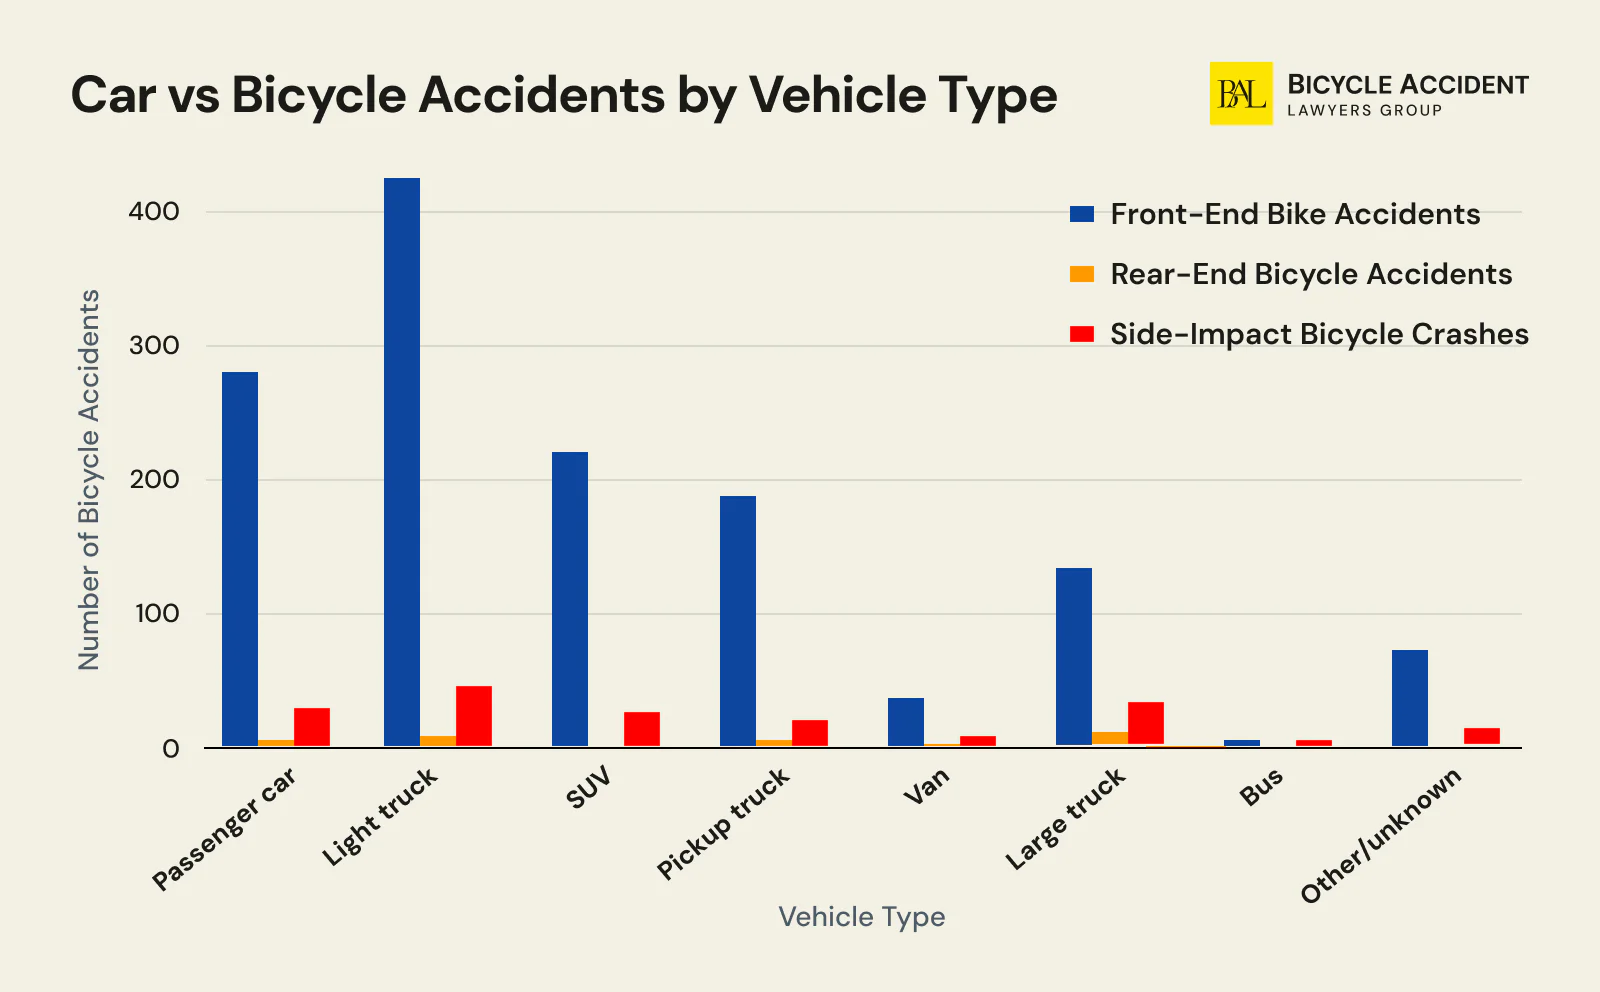
Although any motor vehicle can put a poorly protected cyclist at risk, the recent data proves that some cars are more dangerous than others. Light trucks, a category that includes SUVs, pickups, and vans, are responsible for the highest proportion of bicyclist fatalities, accounting for approximately 46% of all fatal car-vs-bicycle crashes. This is a significant shift from earlier decades, when passenger cars dominated the fatality data.
|
Vehicle type |
Number of bicycle accidents |
Front-end bike accidents |
Rear-end bicycle accidents |
Side-impact bicycle crashes |
|
Passenger car |
320 |
284 |
2 |
22 |
|
Light truck |
499 |
439 |
3 |
39 |
|
SUV |
248 |
221 |
0 |
21 |
|
Pickup truck |
214 |
186 |
2 |
16 |
|
Van |
37 |
32 |
1 |
3 |
|
Large truck |
107 |
58 |
9 |
24 |
|
Bus |
5 |
2 |
0 |
2 |
|
Other/unknown |
104 |
70 |
0 |
5 |
- Almost 95% of cyclists died in single-vehicle accidents in 2022.
- Light trucks (SUVs, pickups, and vans) account for approximately 46% of all deadly car-vs-bicycle incidents, the highest proportion of any vehicle category.
- Over 80% of fatal crashes happened as a result of a front-end collision.
- Rear-end accidents with fatal outcomes are the rarest.
- Buses and large trucks have a noticeably higher side impact rate, potentially due to their size as well as limited visibility.
- The growing market share of SUVs and light trucks on American roads is a contributing factor to this trend. These vehicles have higher front profiles, larger blind spots, and produce greater impact force, all of which increase the severity of a collision with a cyclist.
The Effect of the Area Type on Car vs Bicycle Accidents
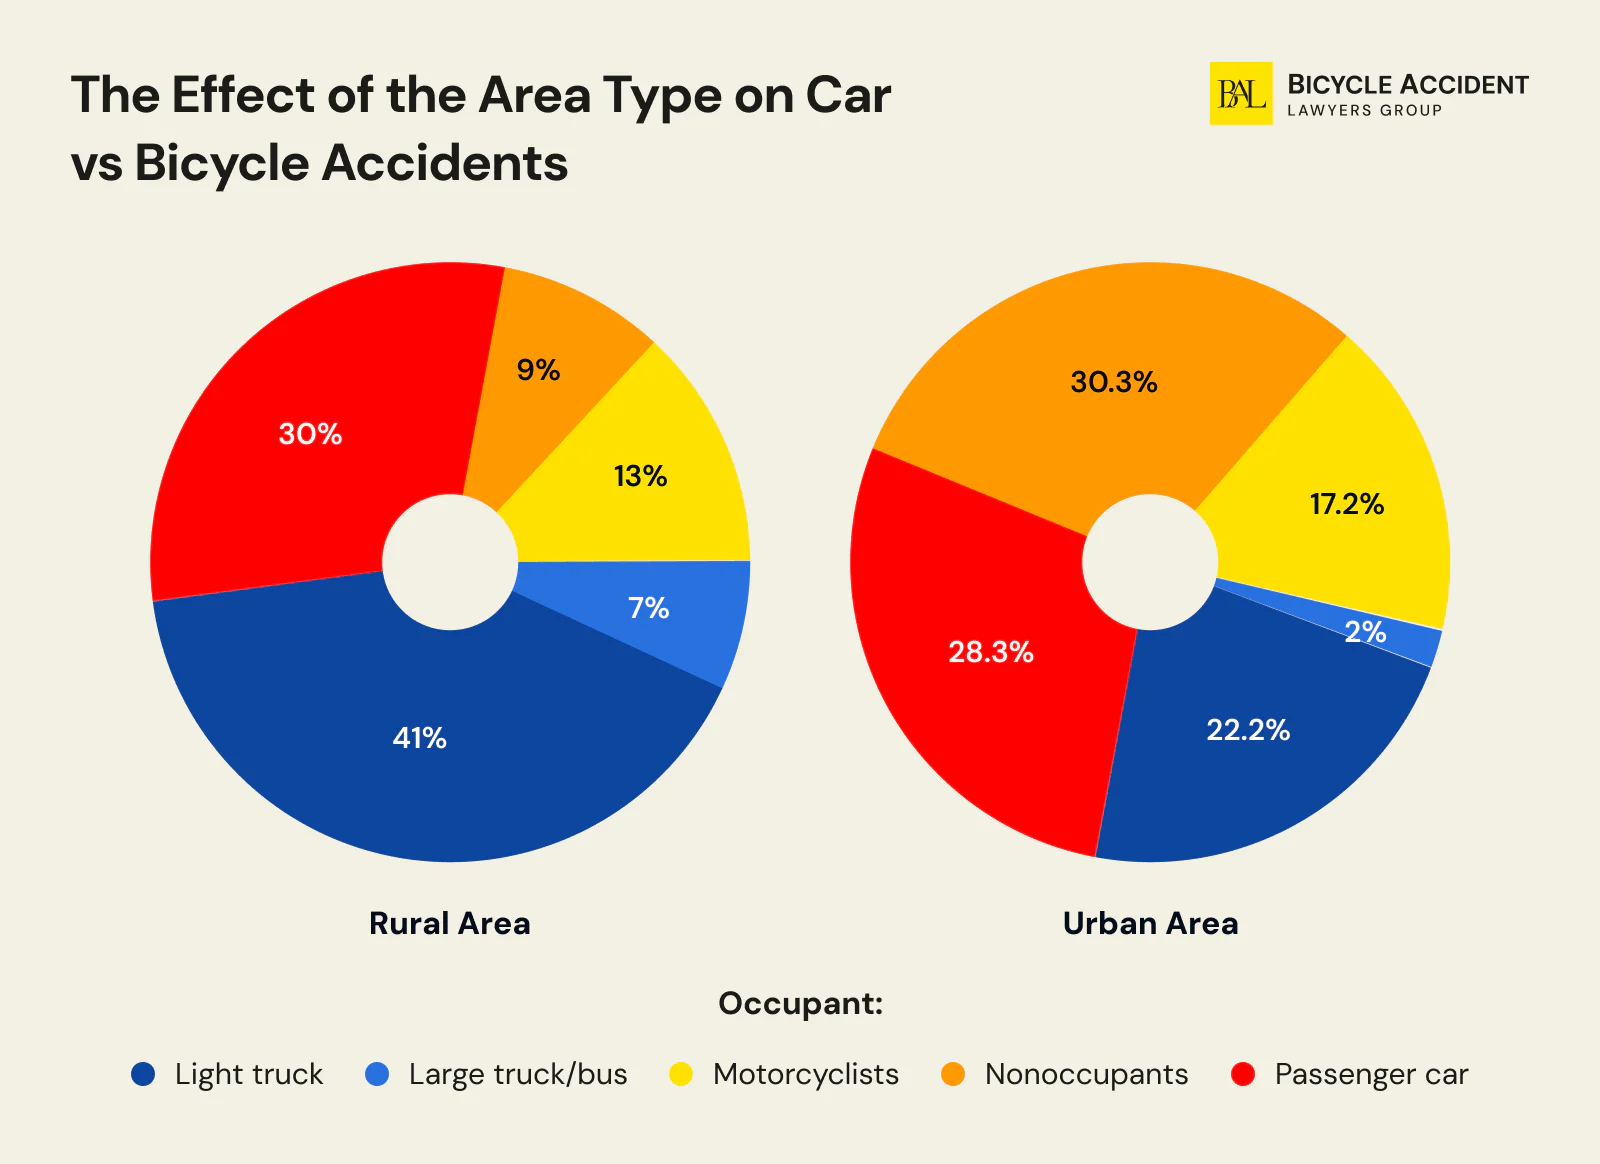
The recent NHTSA survey states that both urban and rural area traffic death rates dropped by 5.4% and 3.7%, respectively. However, the number of fatalities recorded in 2023 in both of these areas still remains concerning. As many as 23,921 people lost their lives in urban zones and 16,656 in rural districts. These casualties include vehicle occupants, bicyclists, and motorcyclists.
Approximately 85% of fatal bicycle accidents occur in urban areas, according to IIHS data. This urban concentration has grown dramatically over the decades. In 1975, only about 50% of bicyclist fatalities occurred in urban settings. By 2021, that figure had reached 86%, reflecting decades of suburban expansion, increasing urban traffic volume, and the concentration of cycling activity on roads designed primarily for motor-vehicle throughput.
|
Occupant |
Rural |
Urban |
|
Passenger car occupants |
30% |
28% |
|
Light truck occupants |
41% |
22% |
|
Large truck/bus occupants |
7% |
2% |
|
Motorcyclists |
13% |
17% |
|
Nonoccupants (including bicyclists) |
9% |
30% |
Recent data show that bicyclists are three times more at risk of injury while riding across urban areas compared to rural ones. 30% of nonoccupant deaths, which include bike riders, are recorded in urban zones, suggesting that higher population density, low traffic safety, and close interaction with motor vehicles contribute to these concerning casualty rates.
At the same time, only 9% of nonoccupant fatalities took place in rural districts. However, that does not necessarily mean that they are safe for cycling. On the contrary, high driving speed and a lack of well-equipped bike lanes make bicycle accidents even more severe, which can also affect the value of Pennsylvania bicycle accident settlements when these crashes lead to substantial injuries and losses.
IMPORTANT! Most rural accidents take place during the day, while many urban-area incidents happen at night.
Car vs Bicycle Accidents by Age
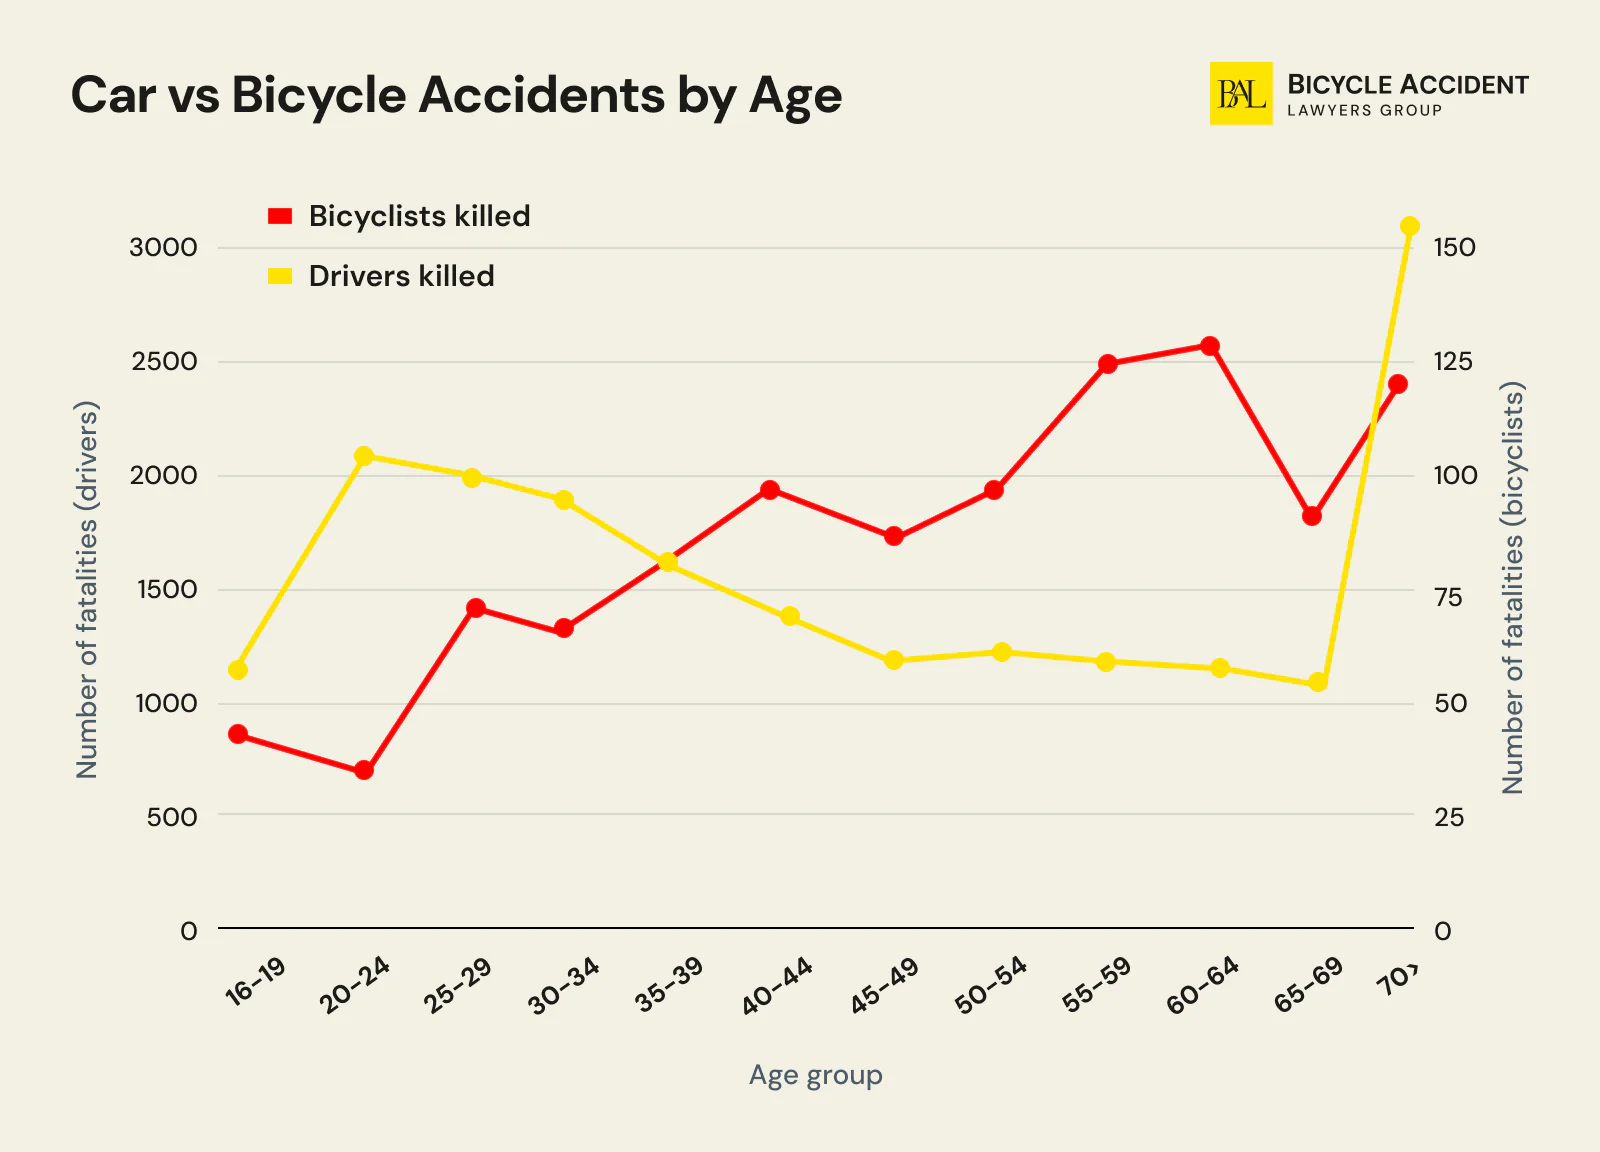
Among various risk factors that may lead to fatal accidents, age group stands out as a significant factor in the statistics of bicyclists killed and drivers killed, affecting both categories of road users, cyclists and motorists alike.
One of the most significant long-term shifts in the data is the age composition of cyclist fatalities. According to IIHS, fatalities among bicyclists aged 20 and older have increased nearly fivefold since 1975, while child cyclist deaths have declined over the same period. This divergence reflects both the aging of America’s cycling population and the fact that older riders are more physically vulnerable to crash injuries.
|
Age |
Cyclists killed |
Drivers killed |
|
<14 |
56 |
N/A |
|
<16 |
N/A |
34 |
|
16-19 |
46 |
1,190 |
|
20-24 |
33 |
2,114 |
|
25-29 |
72 |
2,034 |
|
30-34 |
67 |
1,933 |
|
35-39 |
79 |
1,620 |
|
40-44 |
95 |
1,409 |
|
45-49 |
82 |
1,244 |
|
50-54 |
95 |
1,275 |
|
55-59 |
125 |
1,258 |
|
60-64 |
128 |
1,255 |
|
65-69 |
86 |
1,085 |
|
70> |
120 |
3,085 |
As it turns out, death rates start to spike as bike riders get older. Bike riders in their 60+ seem to be the most vulnerable. There may be a few explanations for that. First of all, older people have slower reaction times and become more physically fragile. At the same time, mature riders often neglect to use helmets and follow visibility rules. Adults aged 55–69 have the highest bicycle death rates of any age group, driven by reduced bone density, longer recovery times, and greater vulnerability to traumatic brain injury.
However, driver deaths are a concerningly high among younger operators, in their 20s-30s. Such statistical data may be the direct reflection of practicing unsafe driving strategies, neglecting traffic laws, impairment, inexperience, and distractions.
Such visible patterns across both types of traffic participants indicate a clear need for better education for young drivers, safer bike paths, and even fitness evaluation for either group.
Bicycle vs Car Accident Statistics by Gender
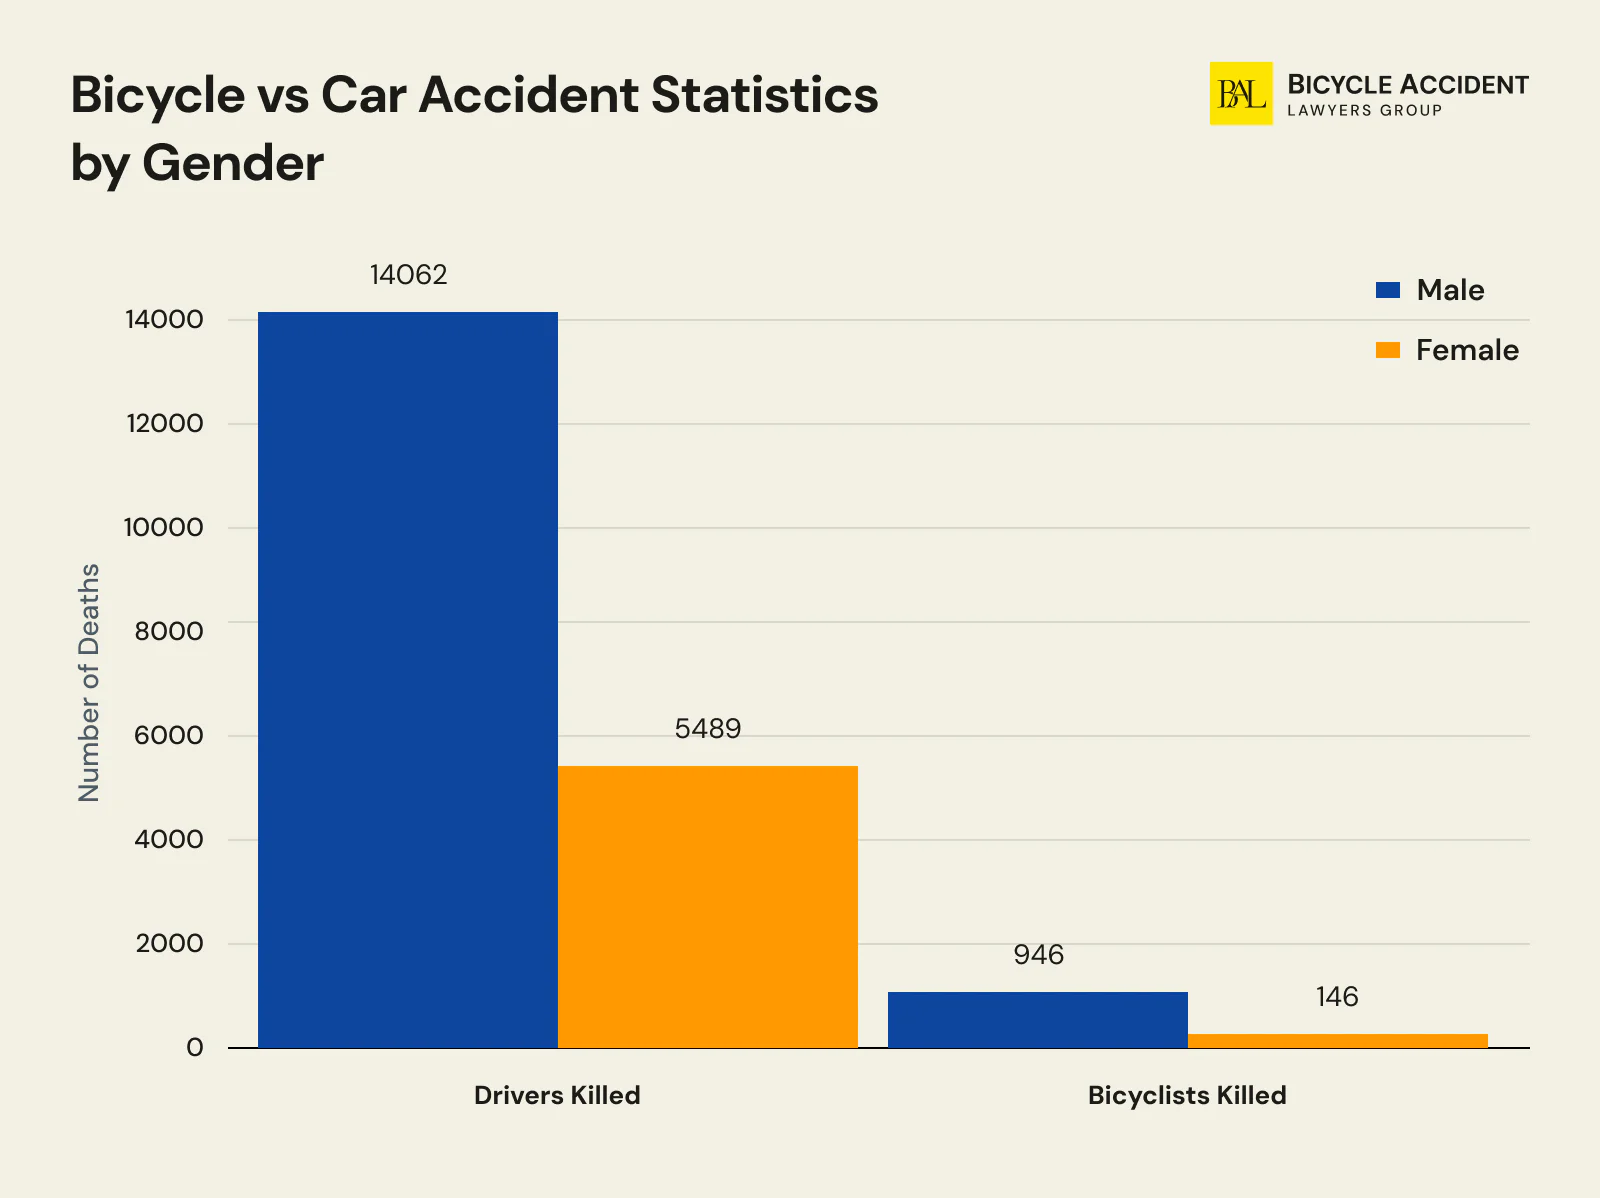
For almost 50 years now, male crash deaths have held the dominant position, regardless of whether it refers to bicycle accidents or motor vehicle collisions. From 1975, traffic-related male fatalities decreased by only 6%.
|
Gender |
Drivers killed |
% |
Cyclists killed |
% |
|
Male |
14,062 |
72% |
946 |
86% |
|
Female |
5,489 |
28% |
146 |
14% |
The data from the table highlights that around 8.5 rider fatalities out of 10 are men. Among plausible reasons why the male death rates are so high would be higher exposure due to cycling under risky conditions and through dangerous environments. Also, demographics come into play, since many men use bicycles to commute in busy urban traffic.
Male driver fatalities are slightly lower than those of bike riders but still reflect a similar picture. This can be due to men representing a more substantial driving exposure. At the same time, the research proves that only 12% of female operators were speeding before an accident, as opposed to 20% of men.
Also, 33% of male drivers killed in 2022 were operating under the influence of alcohol. The same data shows that only 24% of female drivers were fatally injured because of alcohol intoxication.
Helmet Use and Head Injury in Car vs Bicycle Crashes
A majority of fatal car-vs-bicycle accidents involve head injuries, making helmet use one of the most critical safety factors for cyclists. Despite this, the data shows that the vast majority of fatally injured cyclists were riding without one.
- Over 62% of bicyclists killed in traffic crashes were not wearing a helmet at the time of the incident.
- Only 14% of cyclists were confirmed to be wearing a helmet at the time of a fatal crash. The remaining cases were classified as unknown.
- Bicycle helmets reduce the risk of head injury by approximately 48% and serious head injury by approximately 60%, according to a meta-analysis of helmet effectiveness studies.
- Head injuries are the leading cause of death and the most severe category of nonfatal injury among cyclists struck by motor vehicles.
- Unlike vehicle occupants, who benefit from airbags, seatbelts, and crumple zones, cyclists have no structural protection. The helmet is effectively the only barrier between a rider’s head and the road or vehicle surface.
The helmet data underscores a fundamental asymmetry in car-vs-bicycle crashes: the cyclist absorbs virtually all of the impact energy, while the vehicle occupant is shielded by a full protective structure. This disparity in protection is a primary reason why car-vs-bicycle crashes are far more likely to result in serious injury or death for the cyclist than for the driver, even at relatively low impact speeds.
Monthly Trends in Car vs Bicycle Accident Statistics
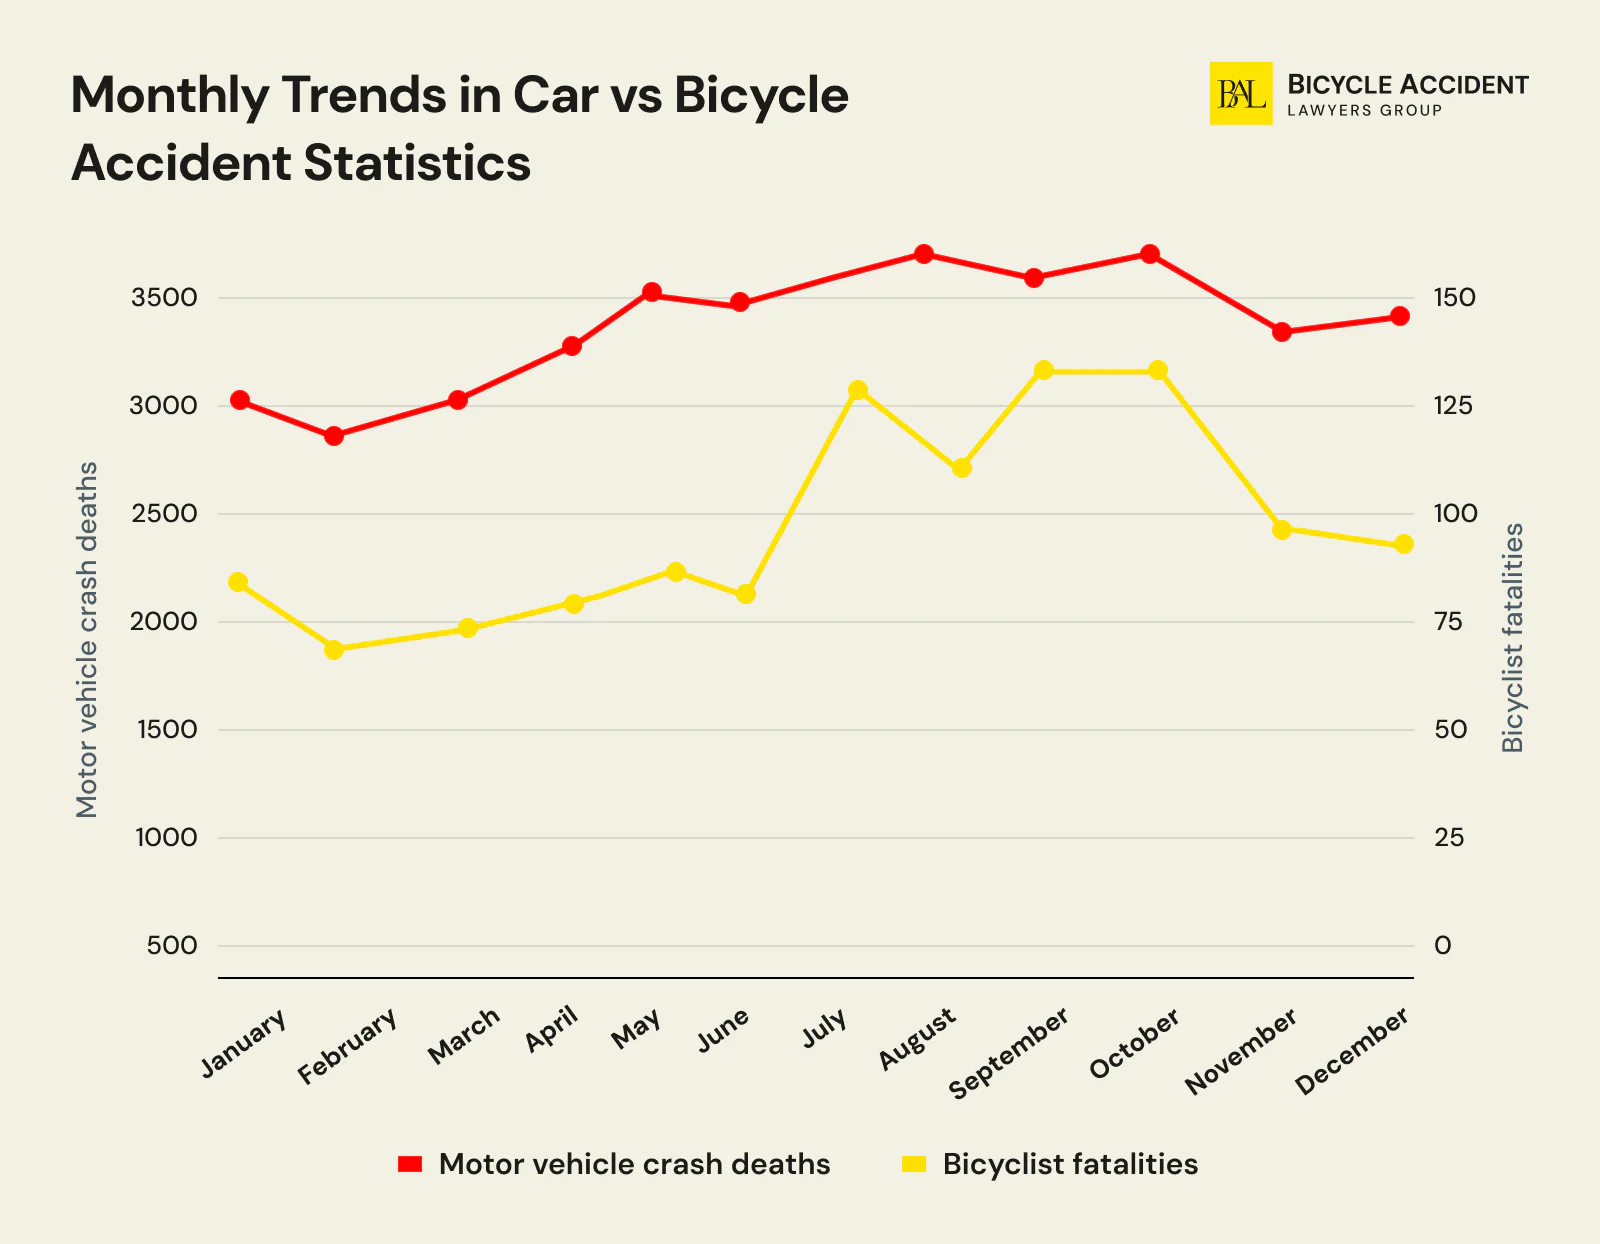
Another factor that affects the number of bicycle accidents across the US is seasonality. Research conducted in 2023 reveals clear seasonal patterns in both motor vehicle crash deaths and bicyclist fatalities, which you may want to consider before going for a ride in summer, autumn, winter, or spring.
|
Month |
Motor vehicle crash deaths |
% |
Bicyclist fatalities |
% |
|
January |
3,024 |
7% |
85 |
7% |
|
February |
2,860 |
7% |
64 |
6% |
|
March |
3,014 |
7% |
73 |
6% |
|
April |
3,344 |
8% |
80 |
7% |
|
May |
3,540 |
9% |
89 |
8% |
|
June |
3,486 |
9% |
81 |
7% |
|
July |
3,694 |
9% |
129 |
11% |
|
August |
3,738 |
9% |
111 |
10% |
|
September |
3,694 |
9% |
132 |
11% |
|
October |
3,787 |
9% |
132 |
11% |
|
November |
3,316 |
8% |
92 |
8% |
|
December |
3,404 |
8% |
87 |
8% |
The midsummer to mid-autumn periods are the peak of cyclists’ deaths in America. While such a surge seems logical, given the increase in outdoor activities, longer days, and multiple hiking opportunities, it is best to keep the data in mind to stay clear of potential danger.
Unlike cyclist fatalities, which peak in the summer and early fall, motor vehicle crash deaths show a relatively even distribution throughout the year.
IMPORTANT! Since cyclist fatalities reflect seasonal volatility, local governments may want to invest in measures and efforts to improve bicyclists’ safety during the high-risk months.
Bicycle Accident Statistics by Time of Day
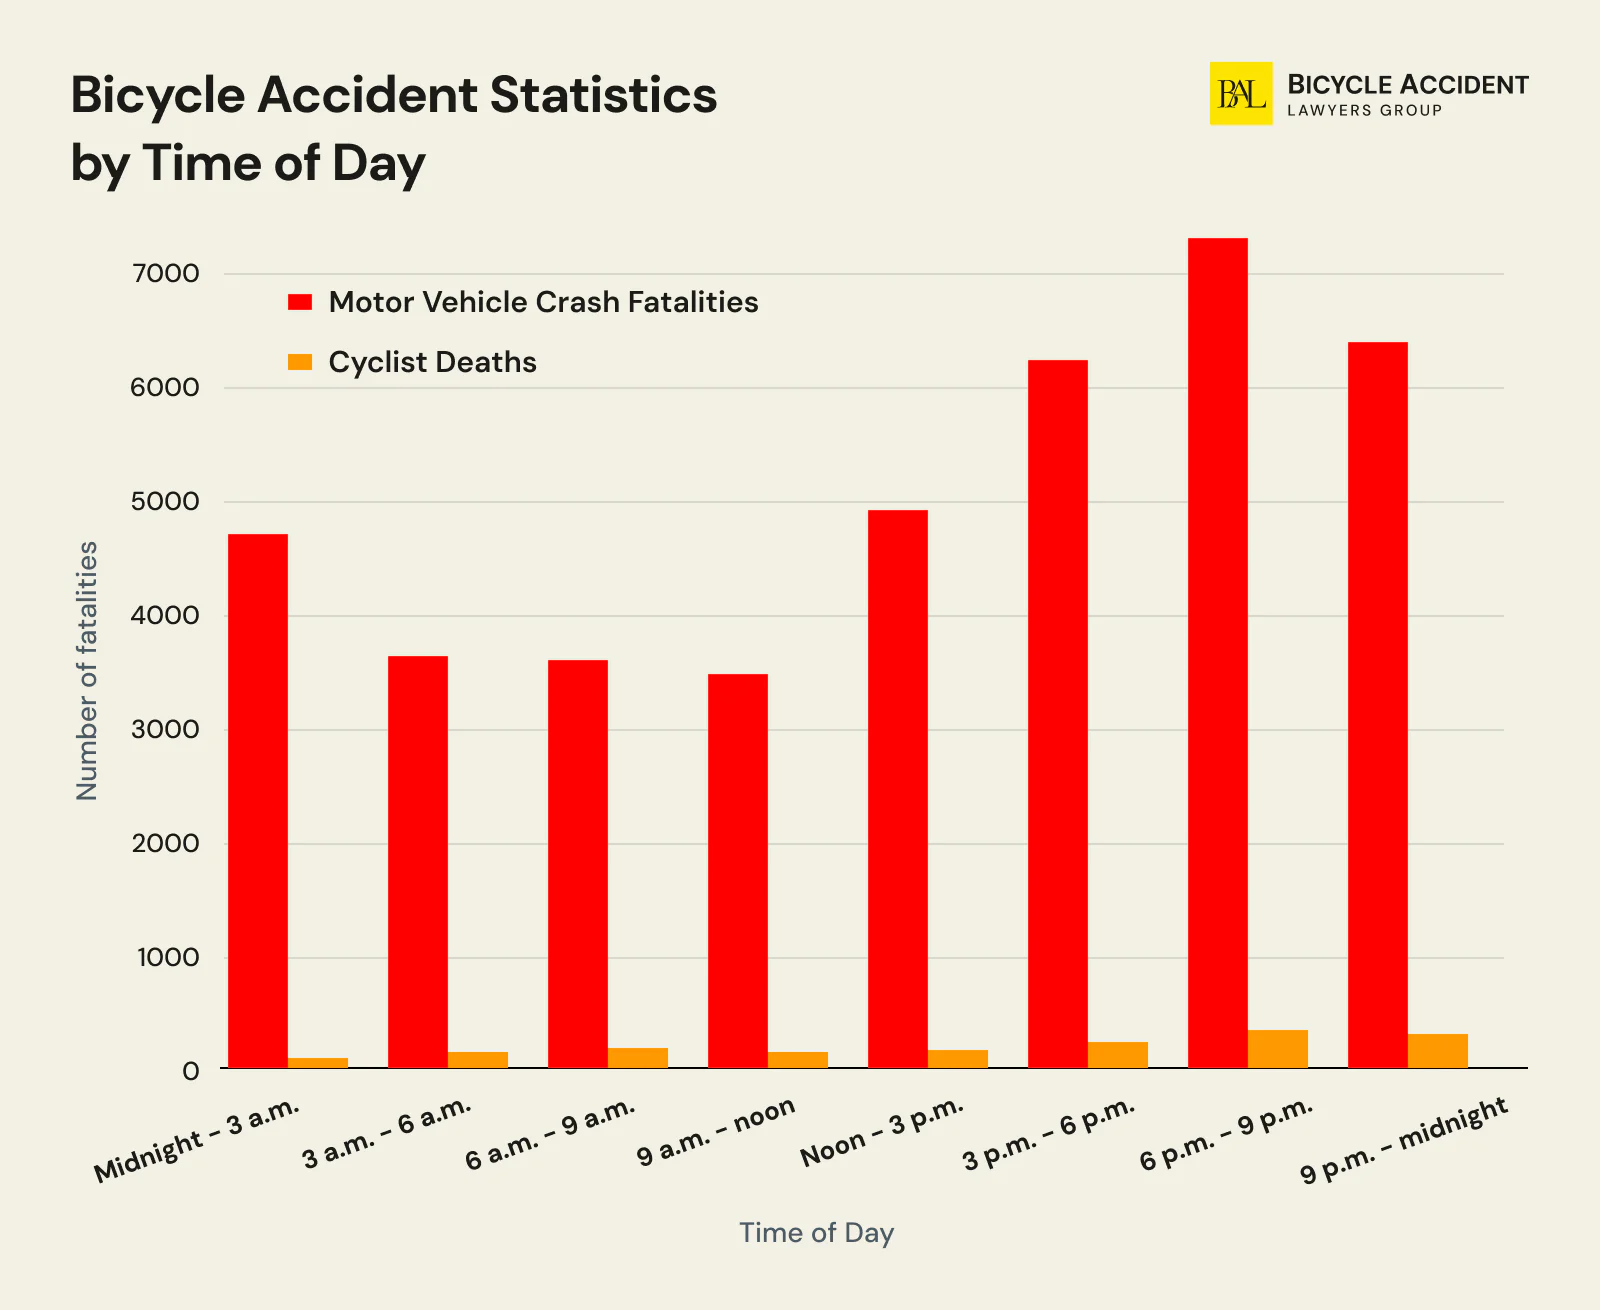
It may seem time-consuming and tiresome to delve as deeply as the depths of “time of the day” deadly crash data. However, the better you are aware of these risk windows, the easier it may be to avoid dangerous situations.
|
Time of day |
Motor vehicle crash fatalities |
% |
Cyclist deaths |
% |
|
Midnight – 3 a.m. |
4,713 |
12% |
82 |
7% |
|
3 a.m. – 6 a.m. |
3,744 |
9% |
93 |
8% |
|
6 a.m. – 9 a.m. |
3,726 |
9% |
126 |
11% |
|
9 a.m. – noon |
3,543 |
9% |
104 |
9% |
|
Noon – 3 p.m. |
4,978 |
12% |
118 |
10% |
|
3 p.m. – 6 p.m. |
6,248 |
15% |
159 |
14% |
|
6 p.m. – 9 p.m. |
7,242 |
18% |
237 |
21% |
|
9 p.m. – midnight |
6,415 |
16% |
231 |
20% |
The table above clearly indicates that evening hours are the deadliest for cyclists. 41% of all fatalities occur from 6 p.m. to midnight. When dusk, dawn, and nighttime hours are combined, over 56% of all bicyclist fatalities occur during reduced-visibility conditions. At the same time, the fatal car accident rate is significantly lower within the same time frame. This may be a direct impact of limited visibility caused by darker hours of the day, higher traffic volume, as well as reduced driver attention or even rush-hour road rage.
Interestingly, morning hours aren’t safe for bike riders, despite good visibility. This data can be explained by busy commuting. When it comes to nighttime, drivers are at risk. Few bicyclists ride during late hours, but drivers on the road at night are prone to speeding, driver fatigue, and impaired driving.
Fatalities in Traffic Accidents by Light Condition
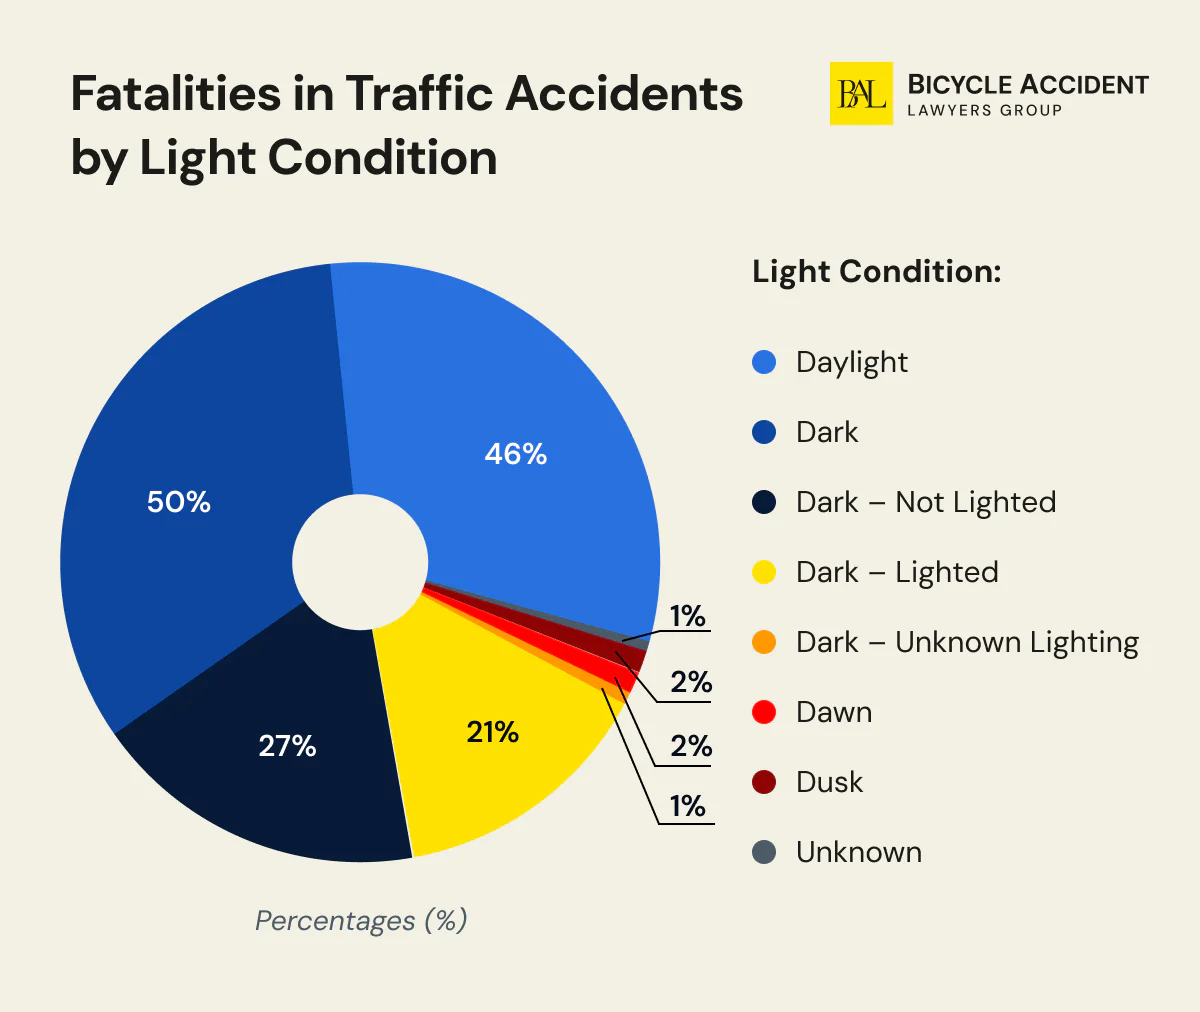
In 2021, the National Highway Traffic Safety Administration decided to observe how the light conditions affect the fatality rate in traffic accidents. Here’s what they discovered.
|
Light condition |
Number of fatalities |
% |
|
Daylight |
19,564 |
46% |
|
Dark |
21,260 |
50% |
|
Dark – not lighted |
11,645 |
27% |
|
Dark – lighted |
9,151 |
21% |
|
Dark – unknown lighting |
464 |
1% |
|
Dawn |
753 |
2% |
|
Dusk |
1,017 |
2% |
|
Unknown |
345 |
1% |
The presented statistical data proves that the dark part of the day is the deadliest. Although general traffic volumes decrease during darker hours, the death rate hits a concerning 50%. Moreover, over half of all deadly incidents take place in areas that lack proper lighting.
Surely, daytime accidents can be as dangerous. However, the underlying cause here may be connected to increased traffic rather than limited visibility. It is important to note that a 2022 survey states that both nighttime and daytime fatalities dropped by 1.5% and 1.9%, respectively, in 2022.
IMPORTANT! Although the fatality rates drop at dawn and dusk. This time of day can be hazardous due to the natural glare and related conditions.
Weather-Related Traffic Accident Statistics
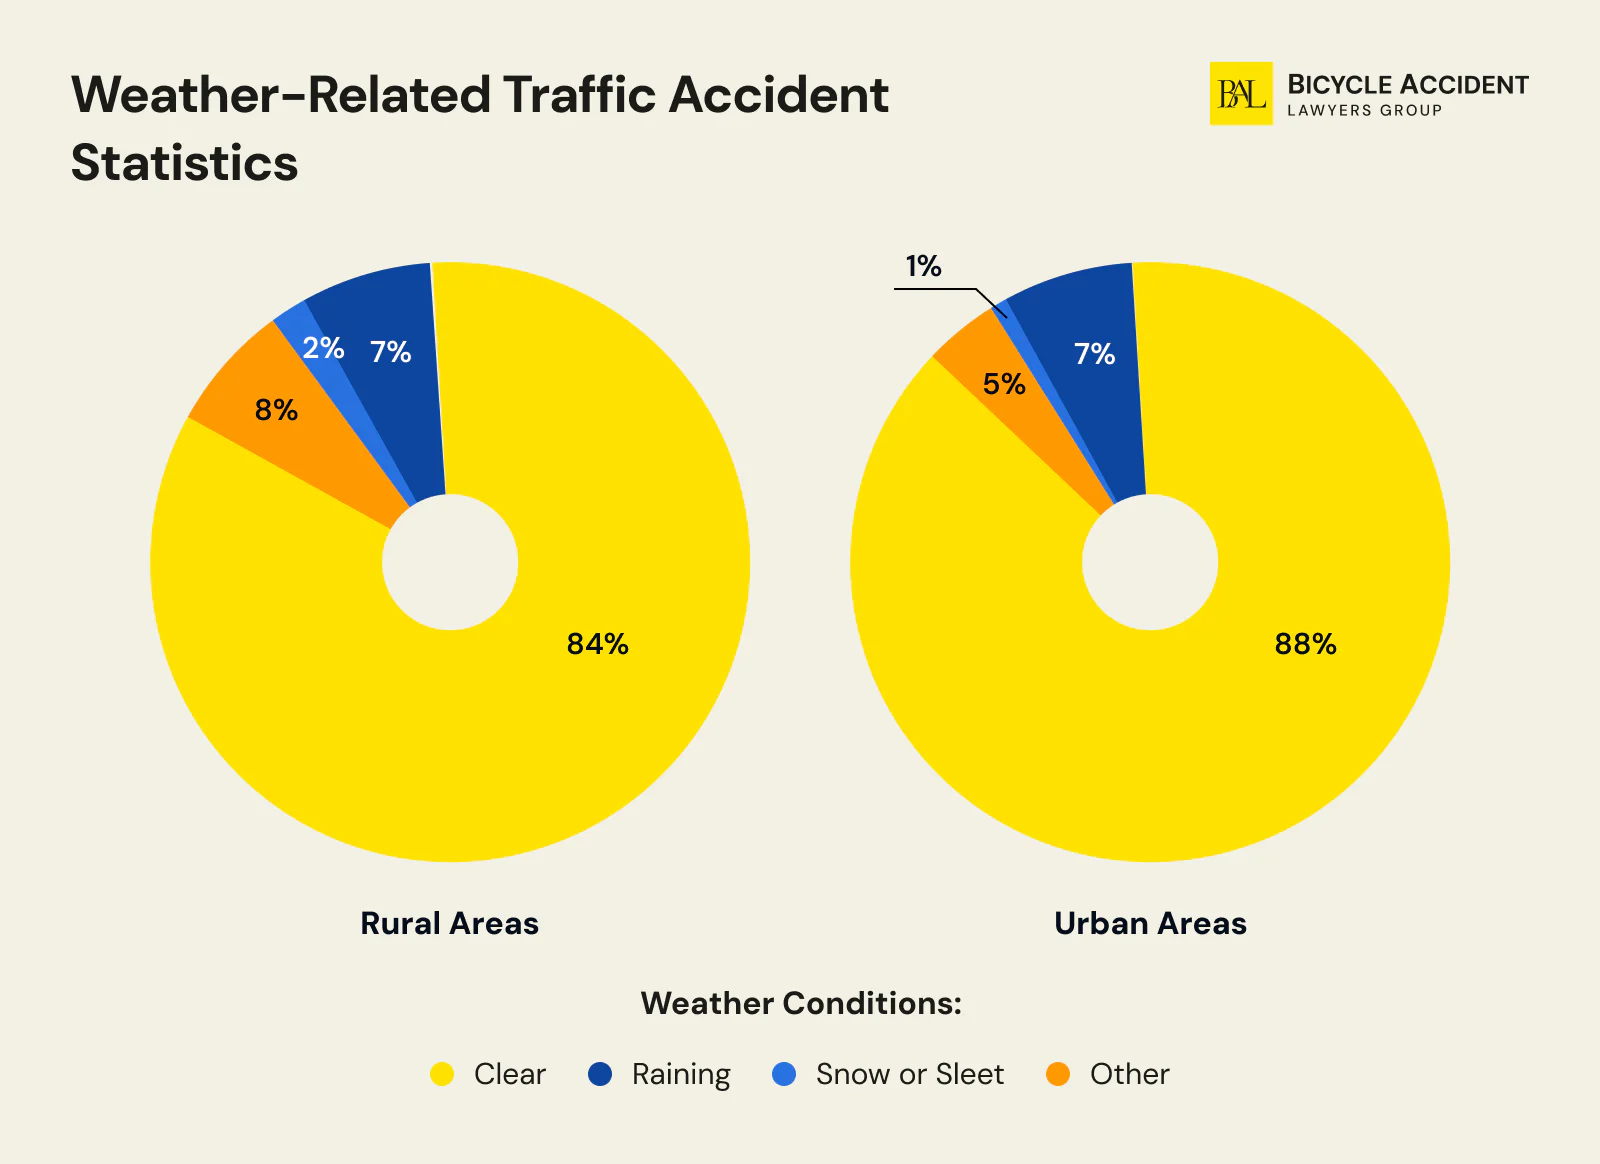
There’s a popular opinion that most accidents happen because of bad weather. However, the data proves that almost 90% of incidents take place when it is clear outside.
|
Weather conditions |
Rural areas |
Urban areas |
|
Clear |
84% |
88% |
|
Raining |
7% |
7% |
|
Snow or sleet |
2% |
1% |
|
Other |
8% |
5% |
The fact that most crashes occur in dry and clear conditions indicates that weather may be a potentially contributing factor, but a minor one. Driver behavior and infrastructure have a major say in the fatality rate.
Both drivers and riders can enhance the safety of their travels by sticking to existing speed limits, avoiding distractions, and using necessary safety gear on the road.
Bike vs Car Accident Statistics by Speeding Involvement
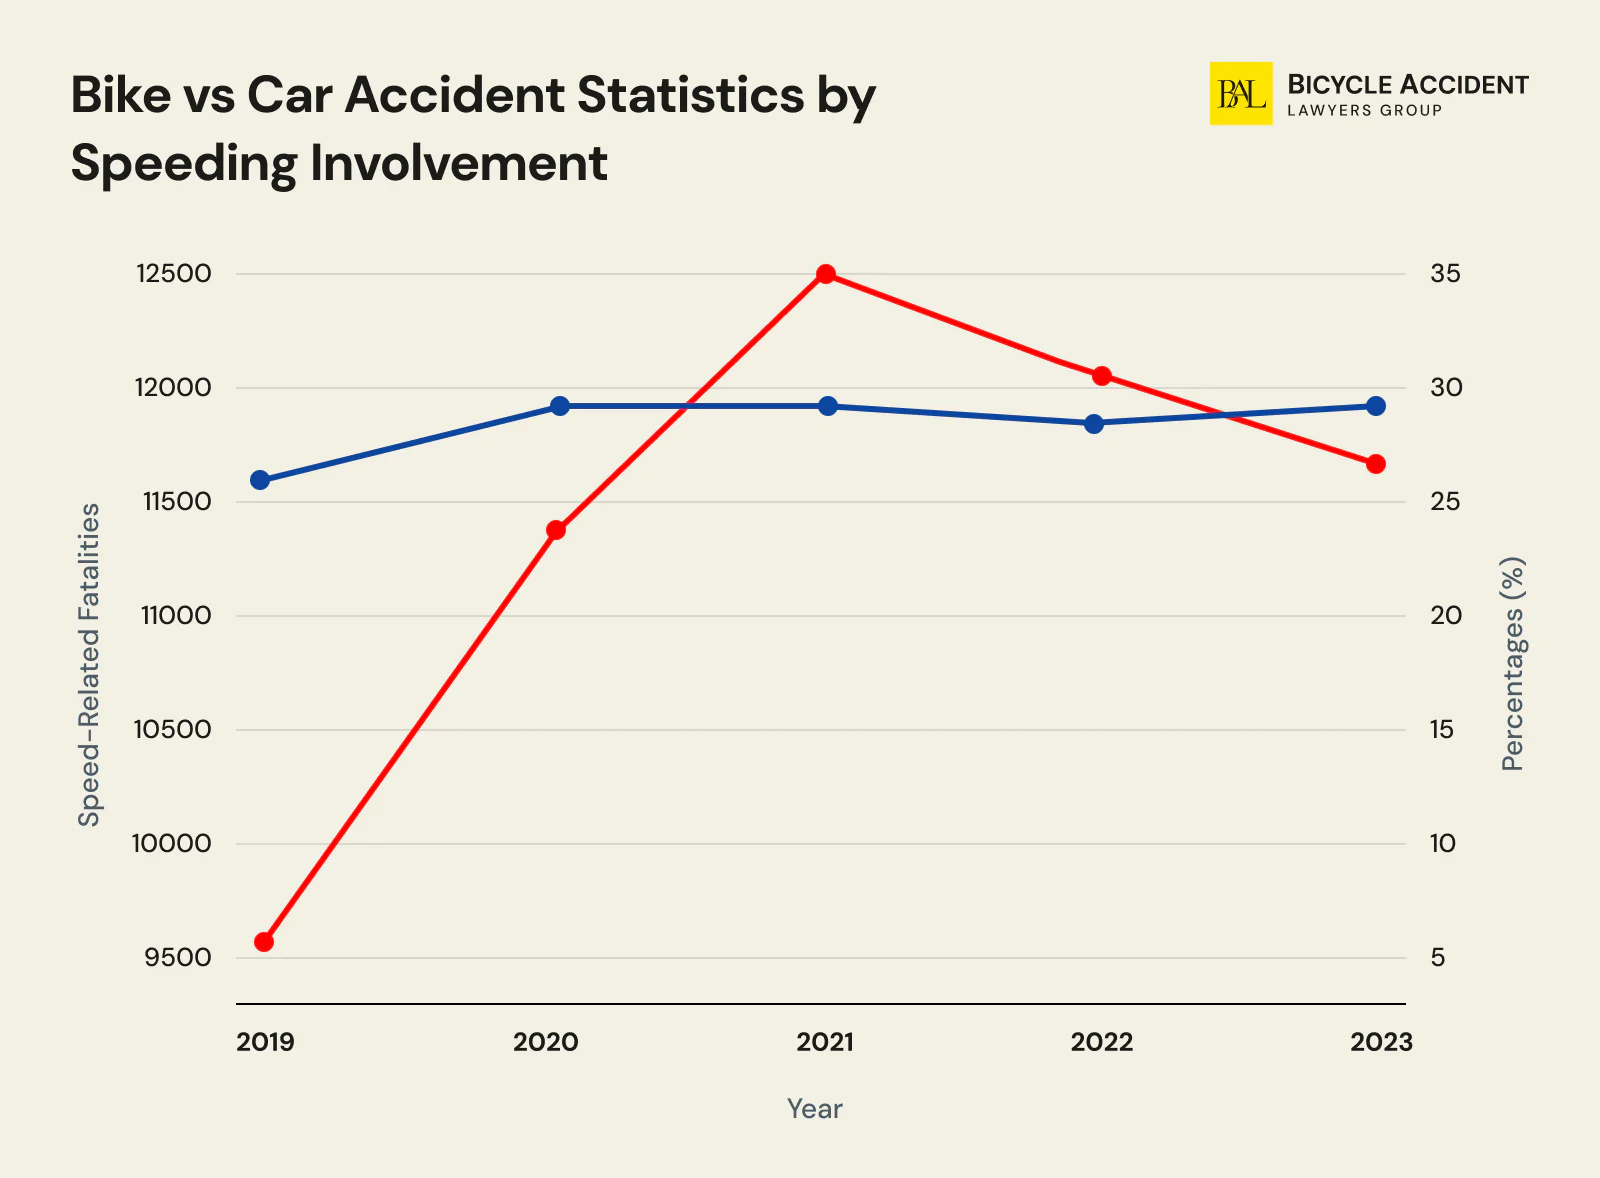
The 2023 survey shows that the number of speed-related fatalities dropped by an impressive 3.1%. Yet, the overall picture remains the same: almost 1/3 of all deadly incidents are triggered by exceeding the speed limit.
|
Year |
Speed-related fatalities |
% |
|
2019 |
9,592 |
26% |
|
2020 |
11,428 |
29% |
|
2021 |
12,498 |
29% |
|
2022 |
12,157 |
28% |
|
2023 |
11,775 |
29% |
According to one of the related studies, speeding is one factor that can multiply the odds of a fatal crash by three. This is especially true for bicycle accidents, as riders are often the least protected road users. For instance:
When driving at 40 mph, a driver has a 15% chance of contributing to a serious accident. At 50 mph, it triples and reaches 59%, while at 55 mph, the risk is as high as 78%.
At the same time, many drivers admit that they don’t mind exceeding the speed limit, no matter if they ride on the highway or through residential areas. As many as one in three motor vehicle operators state that they enjoy driving fast and practice it on a daily basis.
Health Benefits vs. Crash Risk for Cyclists
The crash statistics in this report paint a sobering picture of cyclist vulnerability. However, it’s important to place that risk in the broader context of health outcomes. Despite the elevated danger of car-vs-bicycle crashes, research consistently shows that the long-term health benefits of regular cycling outweigh the statistical injury risk for most riders.
- A large-scale study published in the British Medical Journal found that regular bicycle commuters have a 47% lower risk of death from any cause compared to non-cycling commuters.
- The same research showed a 45% lower risk of developing cancer and a 46% lower risk of cardiovascular disease among bicycle commuters.
- While cyclists are approximately twice as likely to be hospitalized after a crash compared to vehicle occupants (a direct result of the protection disparity covered throughout this report), the cumulative cardiovascular, metabolic, and mental health benefits of regular cycling create a net positive health outcome.
- The American Heart Association and the World Health Organization both recommend cycling as a form of physical activity that reduces all-cause mortality.
This doesn’t diminish the severity of car-vs-bicycle crashes or the urgent need for better infrastructure, driver awareness, and protective measures. But it does mean that the answer to cyclist safety isn’t fewer cyclists on the road. It’s safer roads for the cyclists who are already there.
What to Do After a Car Accident with a Bicycle?
Available bicycle accident statistics surely make you wonder about what happens if you hit a cyclist with your car. Surely, none of the bicycle crashes are the same, but there are a few effective and necessary steps you may want to take to ensure that the vulnerable road user remains as safe and protected as possible.
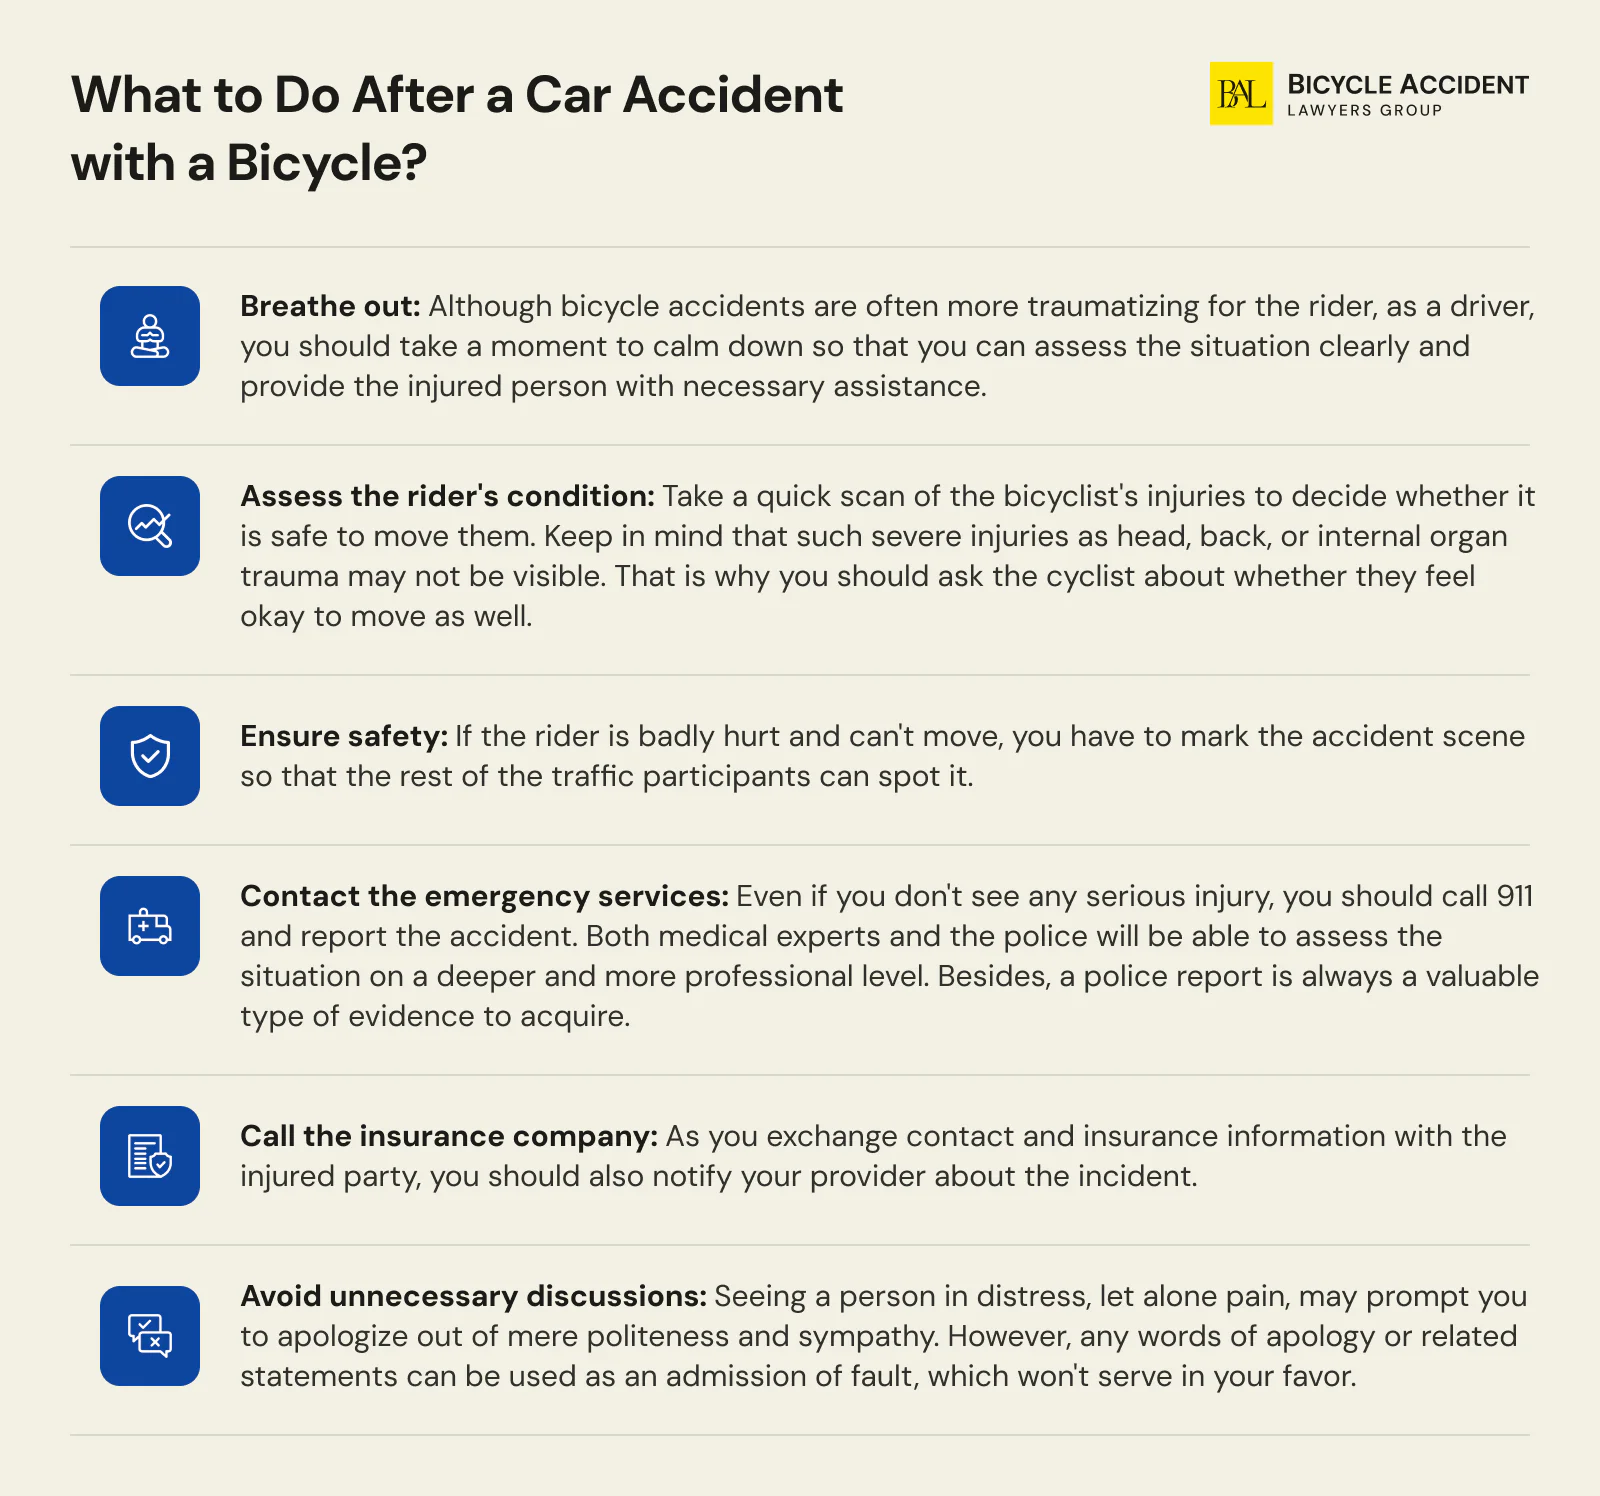
- Breathe out: Although bicycle accidents are often more traumatizing for the rider, as a driver, you should take a moment to calm down so that you can assess the situation clearly and provide the injured person with necessary assistance.
- Assess the rider’s condition: Take a quick scan of the bicyclist’s injuries to decide whether it is safe to move them. Keep in mind that such severe injuries as head, back, or internal organ trauma may not be visible. That is why you should ask the cyclist about whether they feel okay to move as well.
- Ensure safety: If the rider is badly hurt and can’t move, you have to mark the accident scene so that the rest of the traffic participants can spot it.
- Contact the emergency services: Even if you don’t see any serious injury, you should call 911 and report the accident. Both medical experts and the police will be able to assess the situation on a deeper and more professional level. Besides, a police report is always a valuable type of evidence to acquire.
- Call the insurance company: As you exchange contact and insurance information with the injured party, you should also notify your provider about the incident.
- Avoid unnecessary discussions: Seeing a person in distress, let alone pain, may prompt you to apologize out of mere politeness and sympathy. However, any words of apology or related statements can be used as an admission of fault, which won’t serve in your favor.
Who Is at Fault for Car Versus Bicycle Accidents?
Bike accidents involving cars aren’t always as black and white as they seem. In the majority of cases, bicycle crashes can have three potential at-fault parties:
Negligent Drivers
A vehicle operator is the major suspect in a cycling incident, and here’s why:
- Some drivers change lanes without looking out for riders. Such a maneuver can result in a collision, especially if the latter can’t ride on a sidewalk or dedicated lane.
- Many people still open their car doors without looking in the side mirrors. A suddenly opened door can send the biker into traffic or harm them in any other way.
- Since as many as 1 in 3 drivers like high-speed driving, it is safe to assume that some percentage of them treat existing traffic rules the same way. A failure to come to a halt at a stoplight, ignoring traffic lights and signs, often leads to serious cycling accidents.
Irresponsible Municipalities
Some bicycle accidents occur despite both the driver’s and rider’s vigilance. If the city ignores a pothole in the road, forgets to replace a sign, or invests in a poorly designed lane, the local government will be held liable for the damages the victim sustains.
Bicycle Riders
There’s room for a biker’s error in a bike accident. Primarily, a cyclist can be deemed accountable for an incident if they disobeyed traffic rules or misbehaved, which led to a traumatic outcome.
Conclusion
The world of bicycle accidents is overly complicated and multilayered. There’s no magic trick to use to avoid a harmful situation. However, these days we have the opportunity to assess existing traffic incident patterns and derive practical conclusions to stay out of harm’s way.
As you can see, any factor on the scale of time of day to vehicle type and operator’s age or gender can become a predetermined one in a case. Unrestricted access to such data can help an average rider either prevent a collision or, at the very least, know how to act in a situation like that and defend their rights.
Surely, leading the legal battle in the aftermath of a traumatic crash can be challenging and overwhelming. However, our bicycle vs car accident lawyers are always willing to offer a helping hand and take you through the labyrinth of the personal injury law system. If you or someone you love was injured in a bicycle accident, our experienced legal team is here to help you claim the compensation you deserve, with no upfront fees.
Helpful Resources
- IIHS, Fatality Facts 2023: Bicyclists
- NHTSA, Early Estimate of Motor Vehicle Traffic Fatalities in 2024
- NHTSA, Share the Road: It’s Everyone’s Responsibility
- NHTSA, The Economic and Societal Impact of Motor Vehicle Crashes, 2019 (Revised)
- CDC, Transportation Safety
- NHTSA, Traffic Safety Facts 2022
- NHTSA, Traffic Safety Facts Research Notes
- FCC, The Dangers of Distracted Driving
- Traffic Safety Facts 2021
- National Library of Medicine, A Study of Bicycle and Passenger Car Collisions Based on Insurance Claims Data
- IIHS, Fatality Facts 2023, Passenger vehicle occupants
- IIHS, Fatality Facts 2023 Yearly snapshot
- NHTSA, Survey of Speeding Attributes and Behaviors

Since his academic days at the UC Berkeley School of Law, Robert Goldwater has remained a committed advocate for victims of other people’s negligence. His tort law background, together with his unquenchable thirst for justice, helped young Robert found a now-successful law firm – Bicycle Accident Lawyers Group, gathering same-minded and promising attorneys from all over the country.

