



For 2025 the NYPD collision dataset recorded 23 cyclists killed and 5,358 injured in New York City. NYC DOT’s Local Law 13 report counted 4 traditional-bicycle deaths and 4,403 injuries for the same year, and filed 17 further deaths one line down under motorized two-wheelers. Federal FARS counted 22 city cyclist fatalities for 2023 under definitions written for motor-vehicle crashes. Each count is official inside its own definition.
DOT measured 17.1 bicyclist deaths and severe injuries per 10 million trips in 2018, down from 23.5 in 2014, over a decade in which the city’s annual cycling trips grew to 226.3 million. Every figure below names its dataset and its data year, and where two sources disagree this page gives both numbers. If you are reading this after your own crash, the police report behind these crash stats is where your claim and your legal rights start.
- Key Takeaways
- Latest NYC Bicycle Crash Figures
- NYC Bicycle Accident Trends Over the Past Decade
- What Causes Bicycle Accidents in NYC?
- Most Dangerous Streets for Cycling in New York
- Bicycle Accident Statistics by NYC Borough
- NYC Bicycle Accident Statistics by the Season
- NYC Bicycle Crashes by Time of Day
- Helmet Use Among NYC Cyclists
- NYC Bicycle Accidents by Vehicle Type
- Recovering Compensation After an NYC Bicycle Accident
- Got more questions?
- Sources
- Get a FREE case evaluation today
Key Takeaways
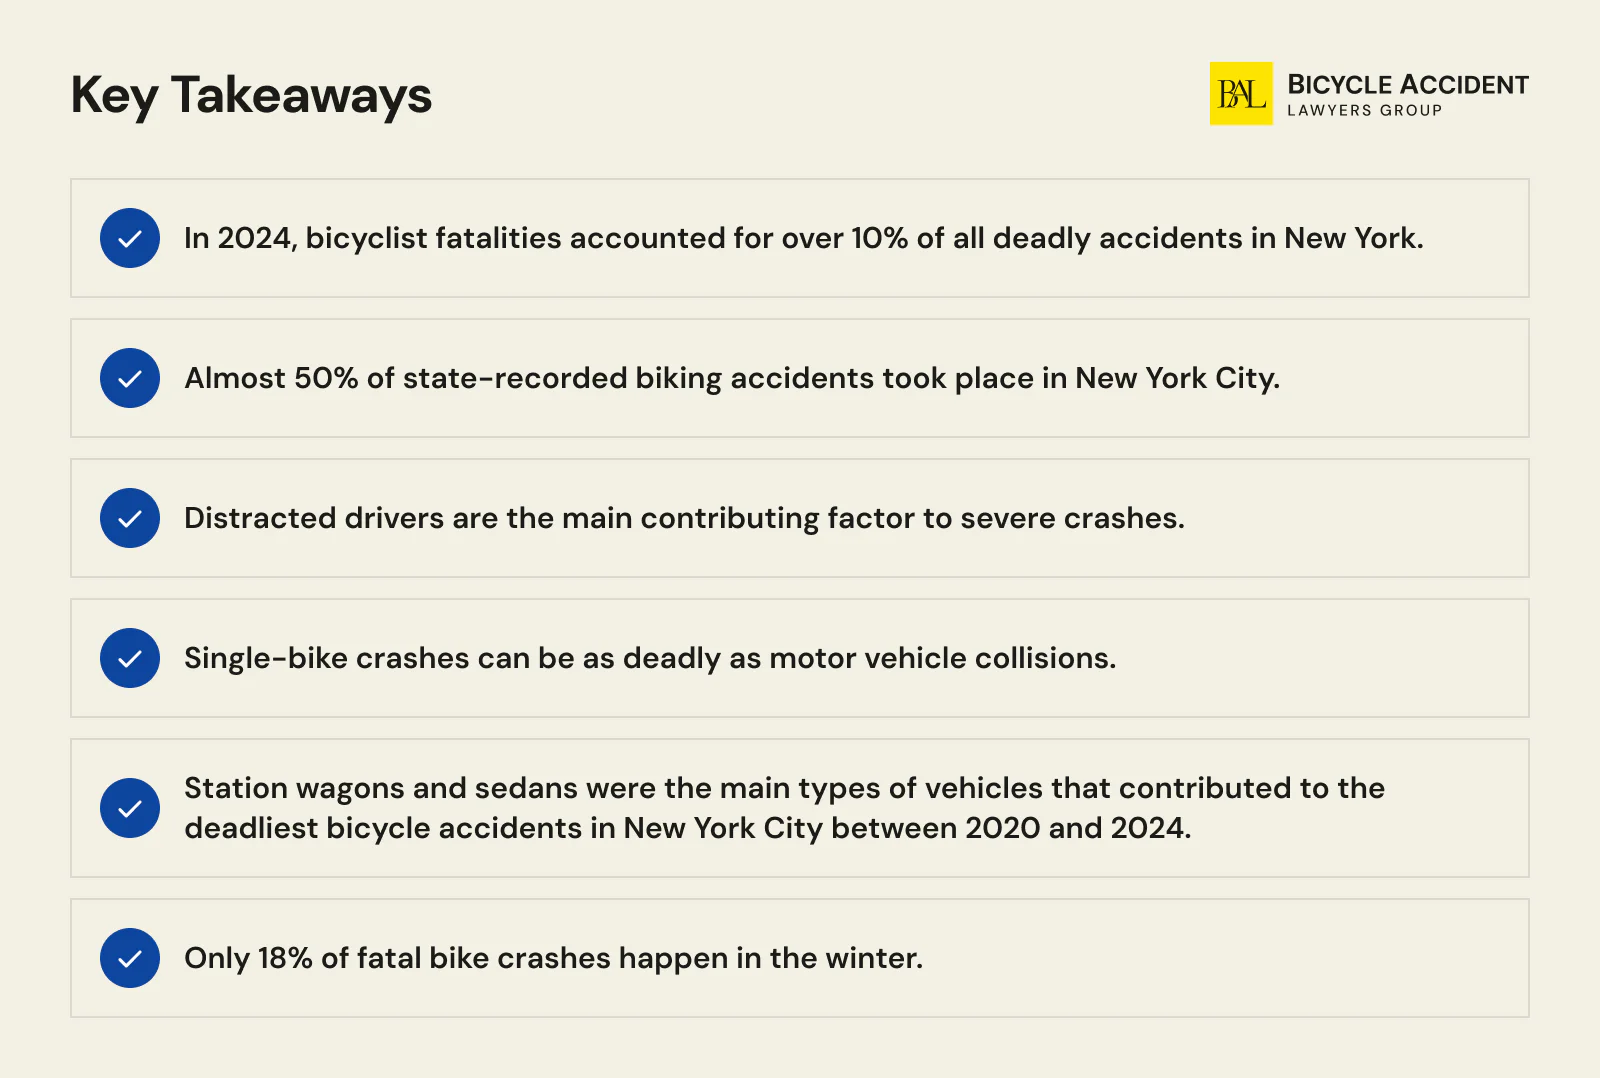
- Two official counts, one year. NYC DOT recorded 4 traditional-bicycle deaths for 2025 and NYPD recorded 23, so name the office before you use either number.
- E-bike riders carry the fatality line. 17 of the 21 bicycle and e-bike fatalities DOT logged in 2025 involved an e-bike rider.
- Manhattan led the injuries, not Brooklyn. DOT’s borough table gives Manhattan 1,510 traditional-bicycle injuries against Brooklyn’s 1,428.
- Your crash may sit outside the headline count. DOT recorded 867 bicycle injuries in 2025 in incidents with no motor vehicle involved.
- The evening commute carries the most injuries. The hours from 4 to 8 p.m. hold 1,658 of the year’s 5,358 cyclist injuries.
- No-fault pays before fault is settled. The driver’s policy owes you up to $50,000 in first-party benefits, with lost earnings at 80% to $2,000 a month.
- The city gives you 90 days, a private driver three years. A pothole claim needs a notice of claim within 90 days of the crash.
Latest NYC Bicycle Crash Figures
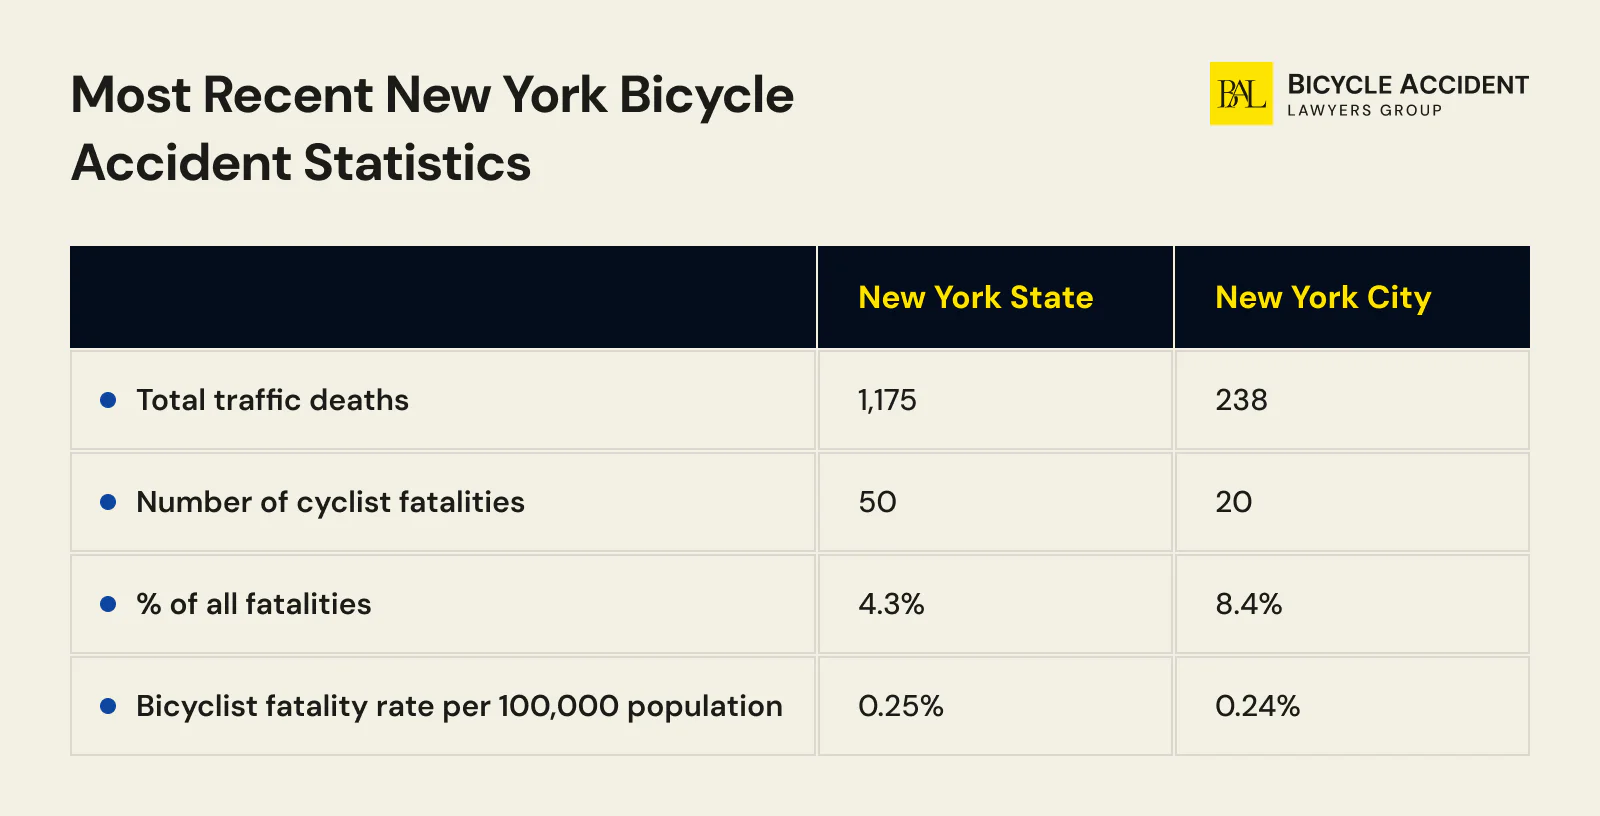
For 2025 the two official counts disagree because each one counts a different set of bicyclists, so NYC DOT’s Local Law 13 report counts 4 traditional bicycle deaths while the NYPD collision dataset records 23 cyclist fatalities. The injury lines split the same way, 4,403 at DOT (Local Law 13 report) against 5,358 at NYPD (NYC Open Data).
|
Measure |
NYC DOT, Local Law 13 (data as of 04/15/26) |
NYPD Motor Vehicle Collisions (New York City Open Data) |
|
Cyclist deaths 2025 |
4 traditional bicycle |
23 |
|
Cyclist injuries 2025 |
4,403 traditional bicycle |
5,358 |
|
2026 so far |
not yet published |
1,940 injured, 11 killed through June 11 |
Each column carries its own definition of the word cyclist. DOT counts traditional bicycles and files e-bikes under motorized two-wheelers, and the NYPD cyclist field counts both machines together. The 2026 NYPD line runs through June 11, the latest crash date the dataset holds. Trips on Citi Bike, New York’s bike share network, sit inside both series alongside private bikes.
NYC Bicycle Accident Trends Over the Past Decade
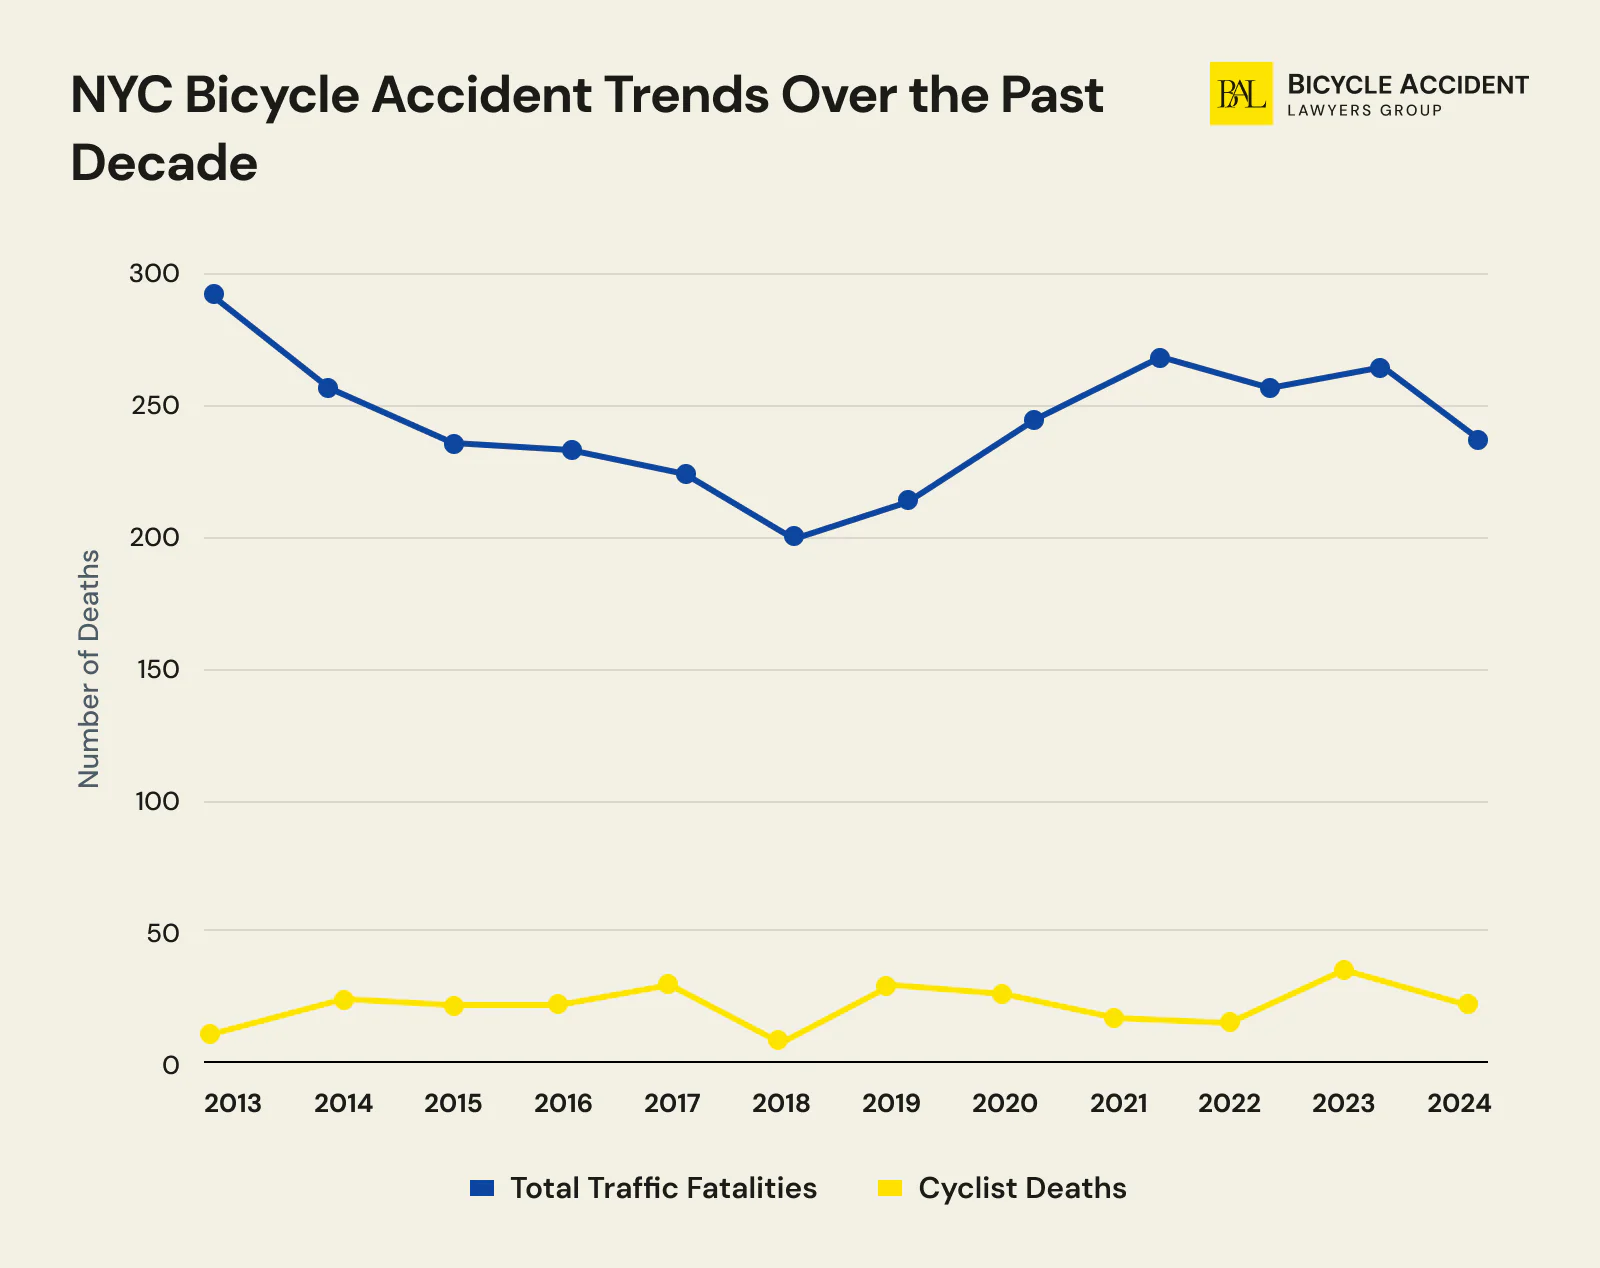
In the past ten years, rider fatalities have fluctuated. The safest year for New York City cyclists was 2018, while the highest number of cyclist deaths was recorded in 2023.
We’ve analyzed the New York City Department of Transportation’s annual bicycle crash data reports from 2013 to 2024. This table summarizes the main findings:
| Year | Total Traffic Fatalities | Bicycle Deaths NYC | % |
| 2013 | 292 | 13 | 4.5% |
| 2014 | 258 | 21 | 8.1% |
| 2015 | 234 | 16 | 6.8% |
| 2016 | 231 | 18 | 7.8% |
| 2017 | 223 | 25 | 11.2% |
| 2018 | 203 | 10 | 4.9% |
| 2019 | 220 | 28 | 12.7% |
| 2020 | 243 | 26 | 10.7% |
| 2021 | 272 | 19 | 7% |
| 2022 | 259 | 18 | 6.9% |
| 2023 | 265 | 30 | 11.3% |
| 2024 | 239 | 24 | 10% |
Nationwide, the recent US bicycle accident statistics and national bicycle fatality trends show that cyclist fatalities have grown by an alarming 75% since 2010. Although NYC’s rates definitely need to be lowered, they are more stable than the national average. The city and its boroughs rank highly in the PeopleForBikes’ City Ratings among large US urban centers, thanks to the recent investments in bicycle infrastructure.
In 2014, the New York authorities launched the Vision Zero program with the ultimate goal of eliminating traffic deaths and increasing bicycle safety. The NYC Streets Plan was introduced in 2019 as part of the initiative. It mandated the construction of 250 miles of protected bike lanes from 2023 to 2026, with a target of building 50 miles each year. However, in 2024, less than 50% of the planned protected lanes were installed.
Despite the challenges in building safe bike infrastructure, the city continues working to achieve Vision Zero by implementing additional safety measures and expanding protected bike lanes across all boroughs. Urban planners and advocates like Transportation Alternatives keep pushing for policies that prioritize cyclist safety and ensure riders can use bike lanes whenever possible instead of mixing with high-speed vehicle traffic.
What Causes Bicycle Accidents in NYC?
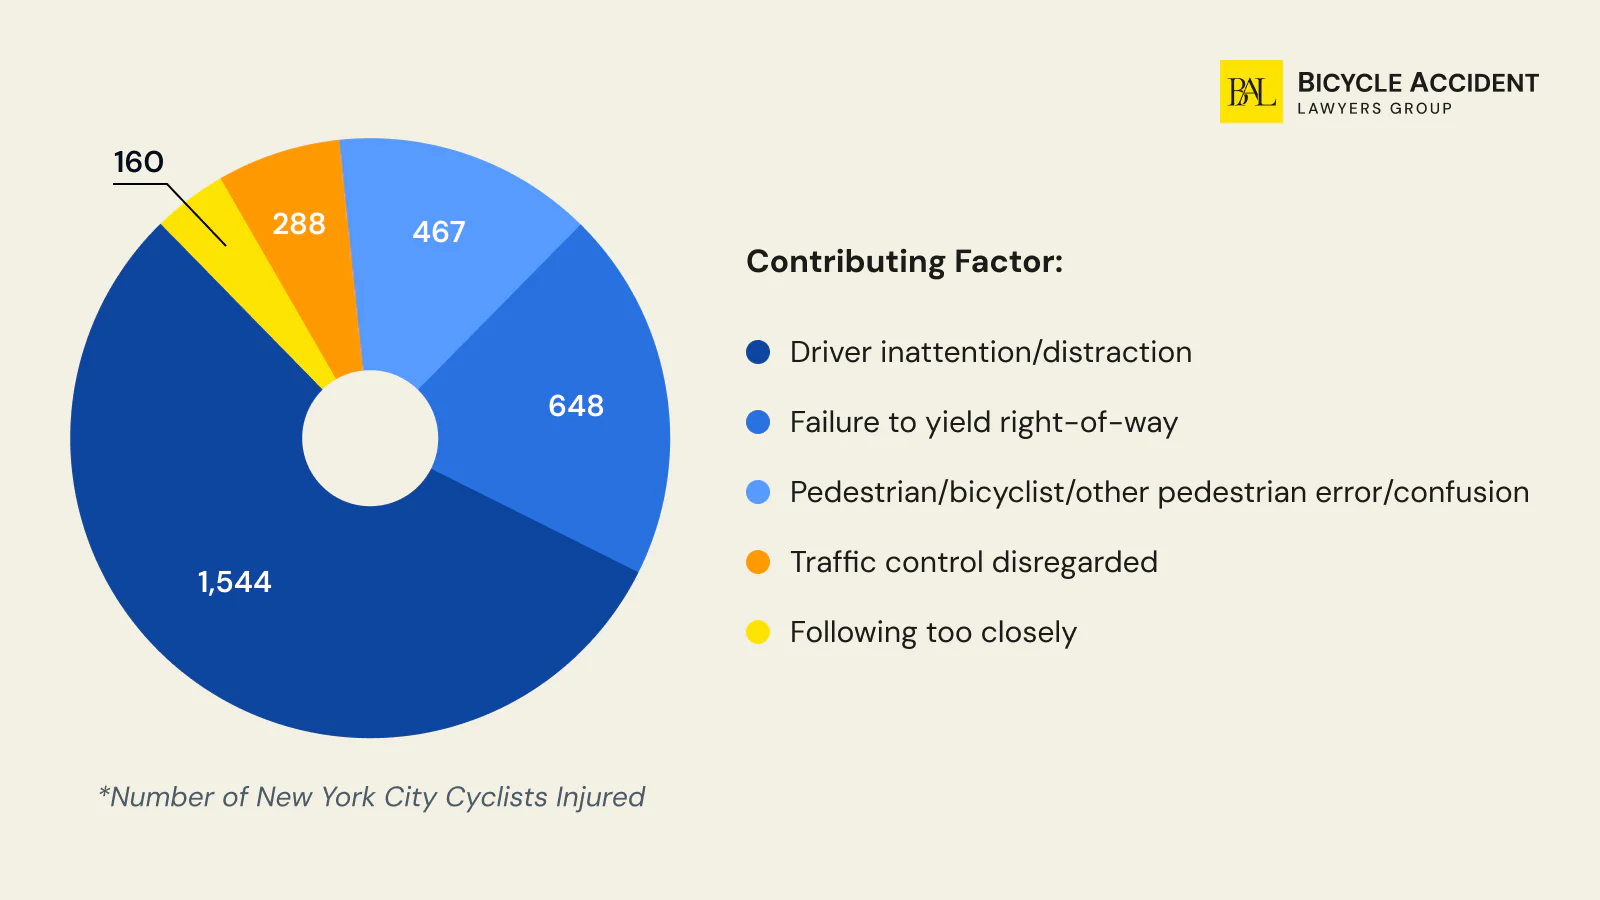
Driver error leads the police-coded causes of NYC bike crashes, with inattention, distraction and failure to yield topping the table. Most happen at intersections, under fault codes an insurer will read later. In 2025 the city logged 5,279 crashes that injured or killed a cyclist (, queried August 24, 2026).
| Contributing factor coded first | 2025 crashes |
|---|---|
| Driver inattention or distraction | 1,489 |
| Unspecified | 1,042 |
| Failure to yield right-of-way | 626 |
| Pedestrian, bicyclist or other road-user error | 440 |
| Traffic control disregarded | 270 |
| Improper passing or lane usage | 213 |
| Following too closely | 172 |
| Unsafe speed | 145 |
Source: , crashes in 2025 that injured or killed a cyclist, queried August 24, 2026.
Driver inattention alone is 28% of the year, more than the next two factors combined. Officers left the cause blank in 1,042 crashes, roughly one in five, and that blank is a caveat on every figure above and below it. Only one row can place fault on the rider, the 440 coded to road-user error, and it does not separate cyclists from pedestrians.
Driver-side factors dominate because motor vehicles are the crash partner in the collisions that kill riders. In 2024, crashes with motor vehicles caused all six traditional-bicycle deaths in the city, per . Bicycle crashes with no motor vehicle involved injured 833 riders that year and killed none.
Each cause is whatever an officer entered on the MV-104AN crash report, the same document your insurer works from. The categories cyclists know best get no row of their own. Dooring is a violation under , but on the form it usually lands under a broader factor, as does a right hook, so the official table understates both.
Recent Statistics of Bicycle Crashes with Motor Vehicles in New York City
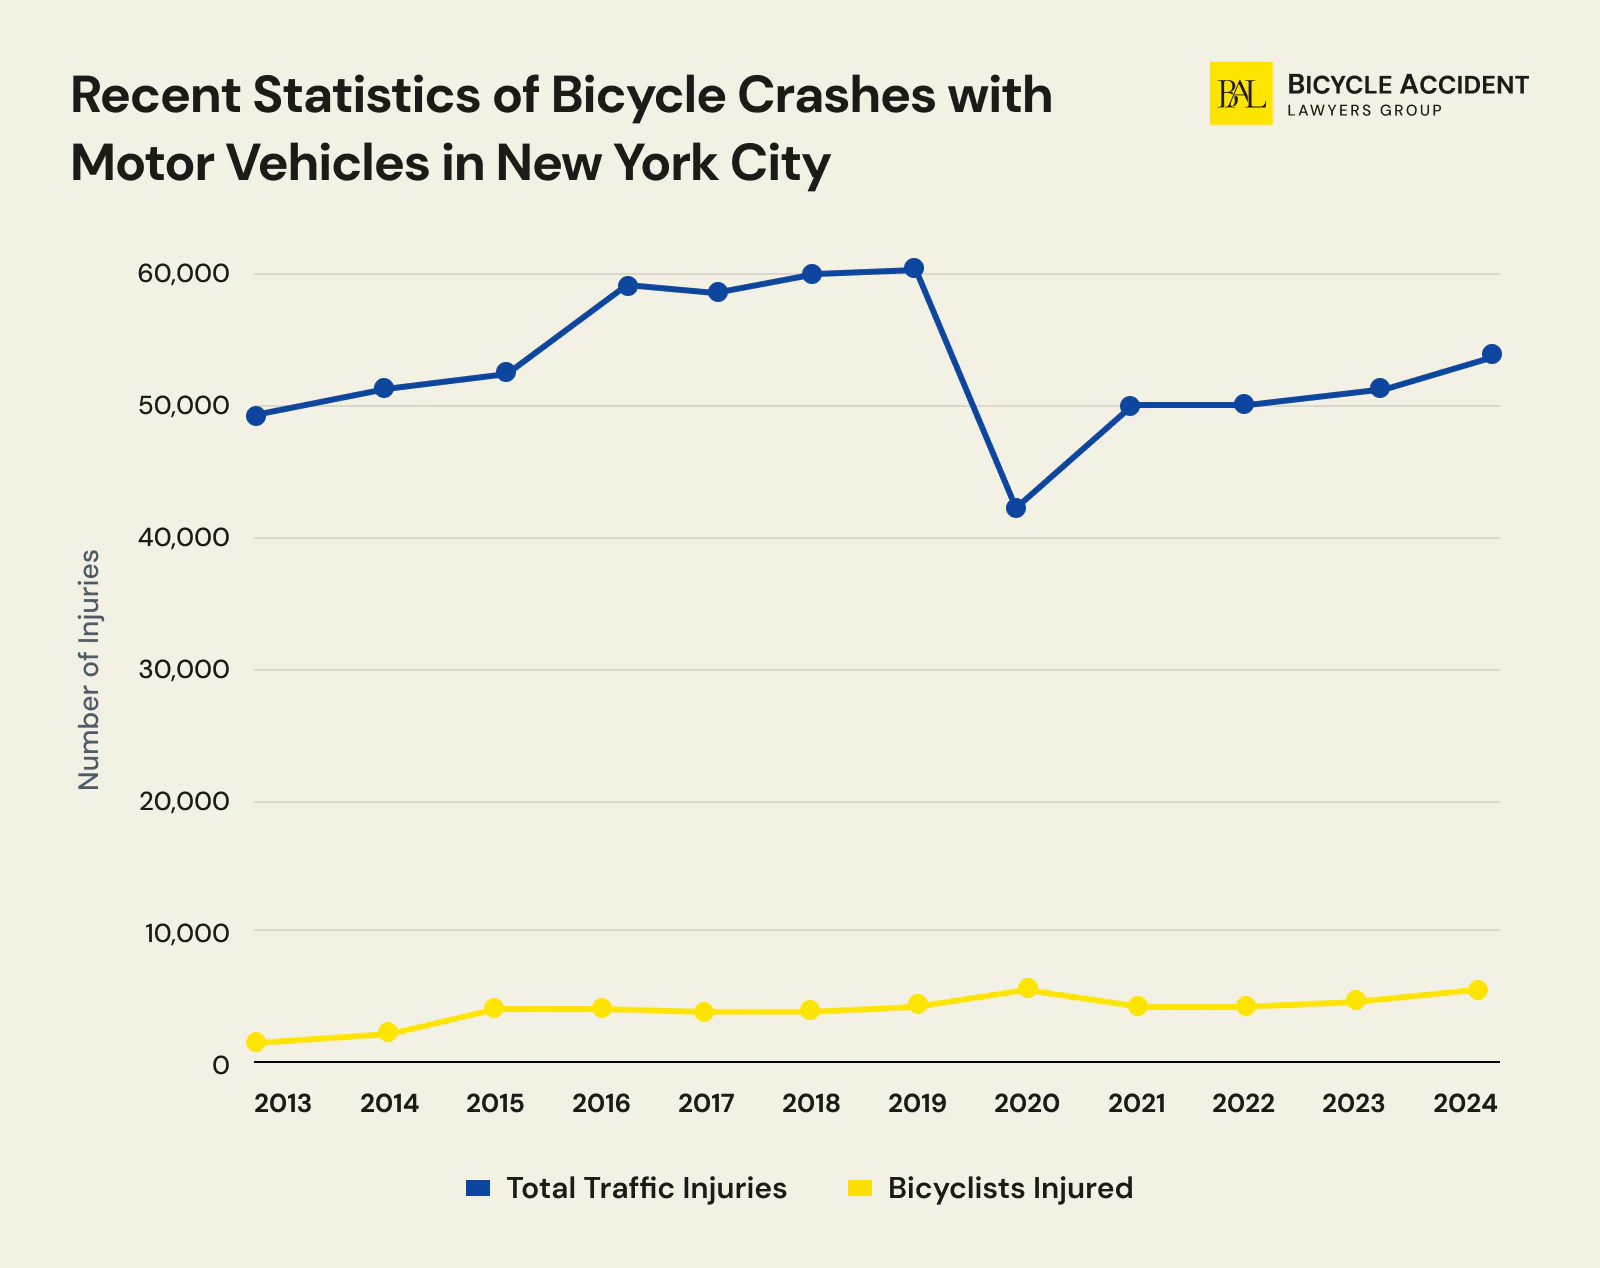
Most bike collisions involve a motor vehicle, whether a driver hits a rider or suddenly opens a car door in their way. Let’s take a closer look at how many New York City cyclists were injured in bicycle accidents with a motor vehicle over the past decade:
| Year | Total Traffic Injuries | Bicyclists Injured | % |
| 2013 | 49,882 | 3,884 | 7.8% |
| 2014 | 51,029 | 3,982 | 7.8% |
| 2015 | 53,163 | 4,433 | 8.3% |
| 2016 | 59,396 | 4,592 | 7.7% |
| 2017 | 58,671 | 4,397 | 7.5% |
| 2018 | 60,652 | 4,304 | 7.0% |
| 2019 | 60,571 | 4,611 | 7.6% |
| 2020 | 43,841 | 5,175 | 11.8% |
| 2021 | 50,729 | 4,618 | 9.1% |
| 2022 | 50,726 | 4,676 | 9.2% |
| 2023 | 52,950 | 4,829 | 9.1% |
| 2024 | 54,005 | 5,148 | 9.5% |
Bicycle Collisions Involving Pedestrians in NYC
For cyclists, pedestrian accidents aren’t as frequent as those with motor vehicles. They rarely result in rider deaths or pedestrian fatalities. However, they remain a serious concern when it comes to both cyclist and pedestrian safety. This table shows how many bike collisions involved pedestrians over the last decade:
| Year | Bicyclists Injured | Bicyclists Killed |
| 2013 | 26 | 0 |
| 2014 | 47 | 0 |
| 2015 | 28 | 1 |
| 2016 | 64 | 0 |
| 2017 | 88 | 0 |
| 2018 | 55 | 0 |
| 2019 | 57 | 1 |
| 2020 | 55 | 1 |
| 2021 | 51 | 0 |
| 2022 | 55 | 0 |
| 2023 | 59 | 1 |
| 2024 | 46 | 0 |
Bicycle-on-Bicycle Collisions in NYC
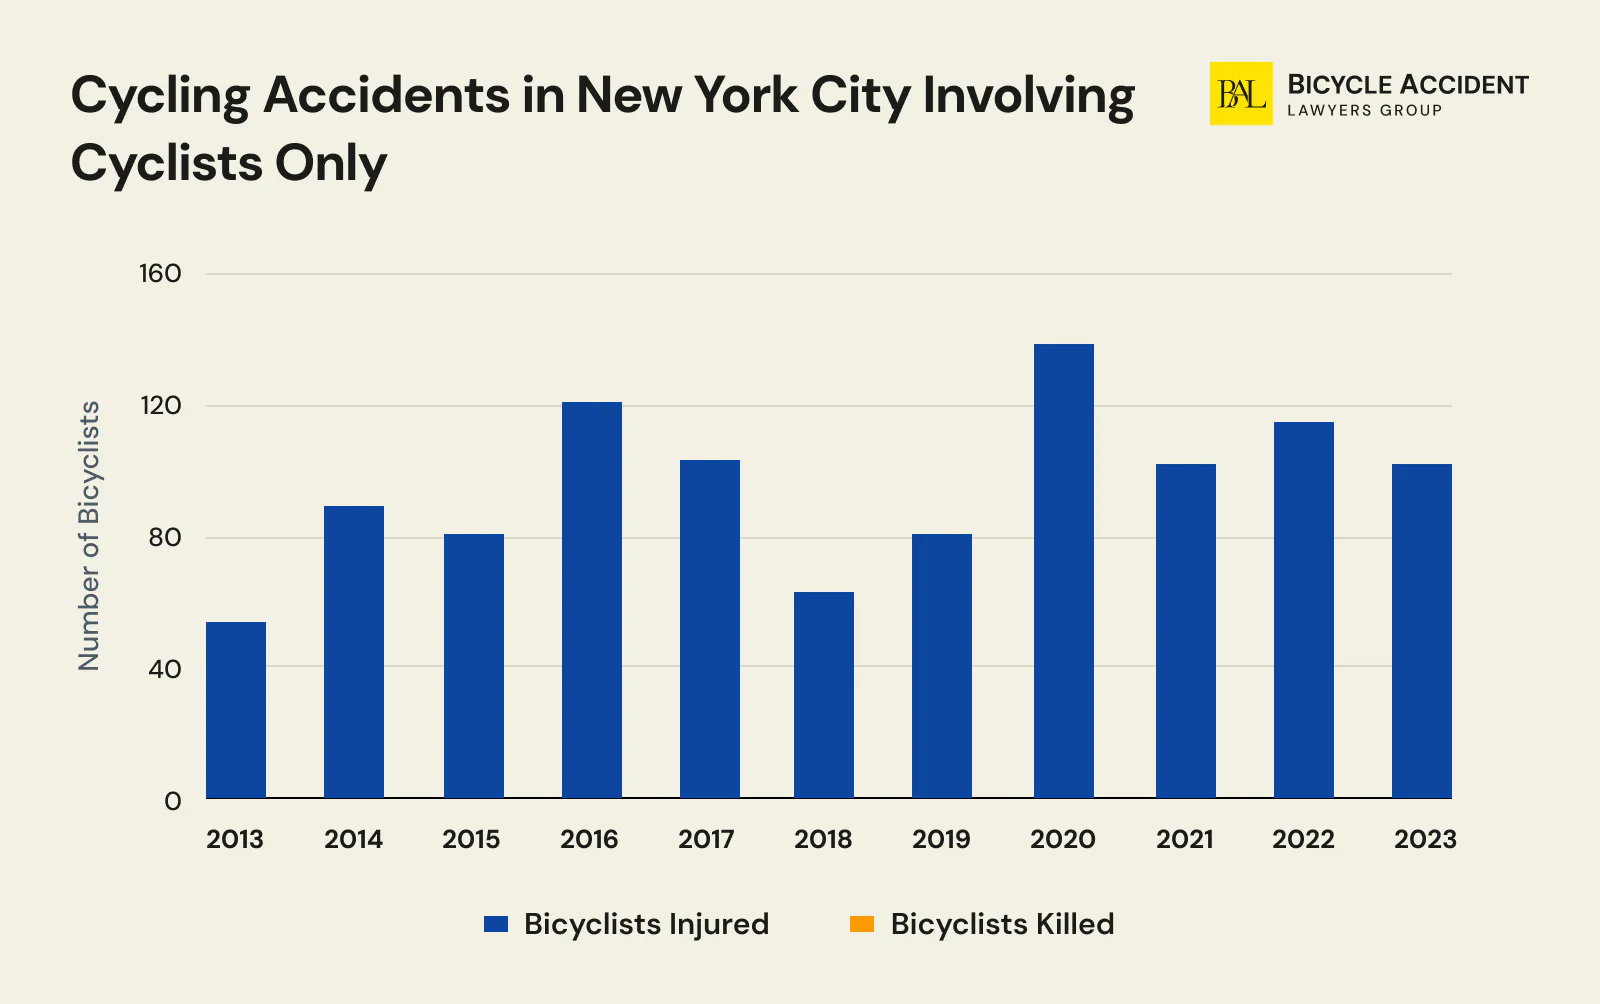
Over the past 10 years, zero cyclist deaths caused by a bicycle-on-bicycle collision have been reported. However, around a hundred people suffer injuries in this type of accident annually. Let’s take a closer look:
| Year | Bicyclists Injured | Bicyclists Killed |
| 2013 | 52 | 0 |
| 2014 | 93 | 0 |
| 2015 | 82 | 0 |
| 2016 | 121 | 0 |
| 2017 | 99 | 0 |
| 2018 | 64 | 0 |
| 2019 | 81 | 0 |
| 2020 | 136 | 0 |
| 2021 | 101 | 0 |
| 2022 | 113 | 0 |
| 2023 | 102 | 0 |
| 2024 | 90 | 0 |
In the majority of cases, these bicyclist crashes are minor, and the parties involved often choose to resolve the incident without reporting it. That is why the available data isn’t as recent or complete.
Why do such crashes happen in New York City? These are the most common causes:
- Sudden turns or stops without proper signaling, whether you are traveling in a designated lane or sharing the road with other vehicles
- A mechanical failure, such as a faulty brake system, broken chain, or blown-out tire
- Negligent New York City cyclists who ignore traffic signs, exceed speed limits, or use their devices while riding.
Single-Bike Crashes in New York City
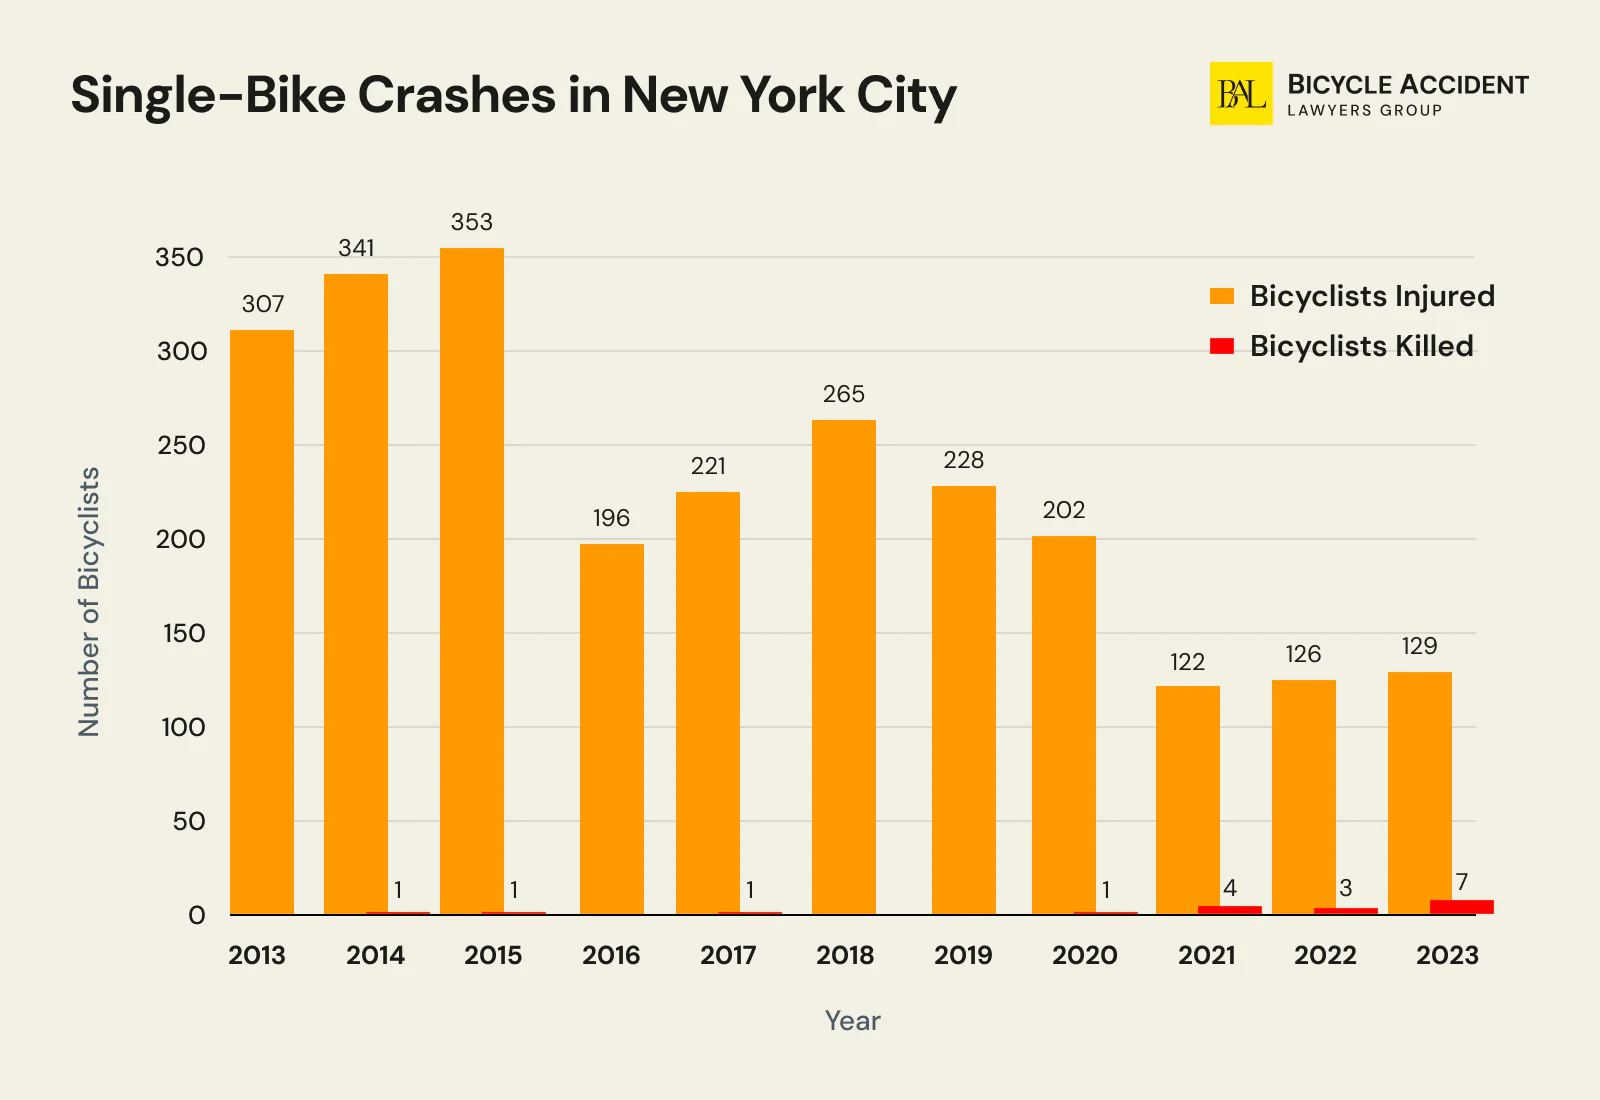
In 2024, more than 600 single-bike incidents were reported in NYC — the highest number in ten years. A single-bicycle accident means that there were no other road users who could have contributed to the collision. However, cyclists can still get seriously injured in such a crash.
Here’s a table reflecting how many bicyclists sustained injuries or died in a solo accident in NYC from 2013 to 2023:
| Year | Bicyclists Injured | Bicyclists Killed |
| 2013 | 307 | 0 |
| 2014 | 341 | 1 |
| 2015 | 353 | 1 |
| 2016 | 196 | 0 |
| 2017 | 221 | 1 |
| 2018 | 265 | 0 |
| 2019 | 228 | 0 |
| 2020 | 202 | 1 |
| 2021 | 122 | 4 |
| 2022 | 126 | 3 |
| 2023 | 129 | 7 |
| 2024 | 605 | 0 |
These collisions are usually caused by incomplete or poorly maintained bike infrastructure. For instance:
- Potholes: If a bicycle wheel gets caught in a pothole, it can unbalance the rider and throw them from the bike.
- Debris: Fallen leaves or piles of gravel can hide broken glass or potholes that can also create hazards for cyclists.
- Slippery surface: Wet and icy surfaces reduce traction. A sliding bike is harder to control. Besides, the vehicle may not brake in time to avoid a potential collision.
- Lack of experience: Some situations require quick reactions, and New York cyclists with insufficient riding experience often struggle to handle sudden shifts and obstacles.
Most Dangerous Streets for Cycling in New York
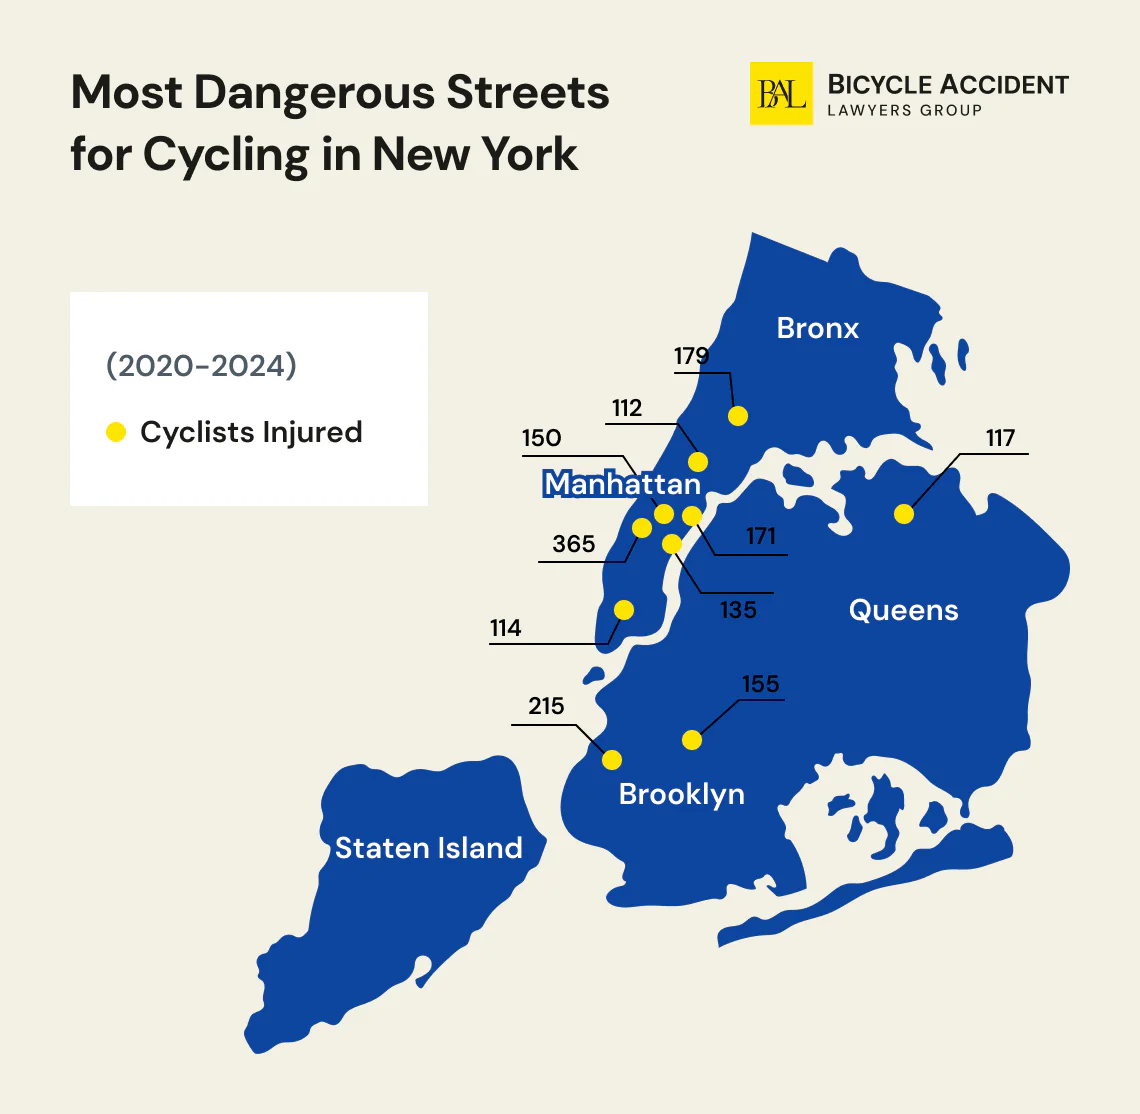
Broadway tops NYC’s cyclist-injury corridors at 385 injuries in 2023-2025. NYPD recorded the location of 3,726 of the period’s 15,687 cyclist injuries in the cross-street field of its collision records, 3,699 of them as house-number addresses, and the table below returns each one to the street it happened on.
|
Street or corridor |
Cyclist injuries 2023-2025 |
Cyclist deaths |
|
Broadway |
385 |
2 |
|
Third Avenue |
196 |
1 |
|
Fourth Avenue |
187 |
2 |
|
Fifth Avenue |
171 |
0 |
|
Bedford Avenue |
171 |
0 |
|
Second Avenue |
167 |
1 |
|
First Avenue |
144 |
2 |
|
East Drive |
131 |
1 |
|
West Drive |
129 |
0 |
|
Northern Boulevard |
124 |
1 |
- The repair. Our analysis recovered house-number addresses NYPD filed in the cross-street field and normalized spelling variants (“4 AVENUE” with “4 AVE”). Fifth Avenue moved from 98 to 171 injuries, Flatbush Avenue from 60 to 100.
- Borough labels come from the data. Fourth Avenue is 165 Brooklyn of 187, Second Avenue 142 Manhattan of 167, and Broadway runs through all five, with 159 injuries in Manhattan, 76 in Brooklyn, 52 in Queens, 14 in the Bronx and 3 on Staten Island.
- 2,701 injuries carry a blank borough field. That is 17.2% of the period’s total in the NYPD file, and it includes 80 of East Drive’s 131 injuries and 77 of West Drive’s 129.
- Danger is spread thin. Those 15,687 injuries land on 2,476 streets across the five boroughs’ neighborhoods, and the ten worst corridors hold 11.5 percent of them (NYPD).
- Traffic deaths follow a different map. The 78 cyclist fatalities fell on 74 separate streets, no street took more than two, and 11 fell on the twenty highest-injury corridors.
Bicycle Accident Statistics by NYC Borough
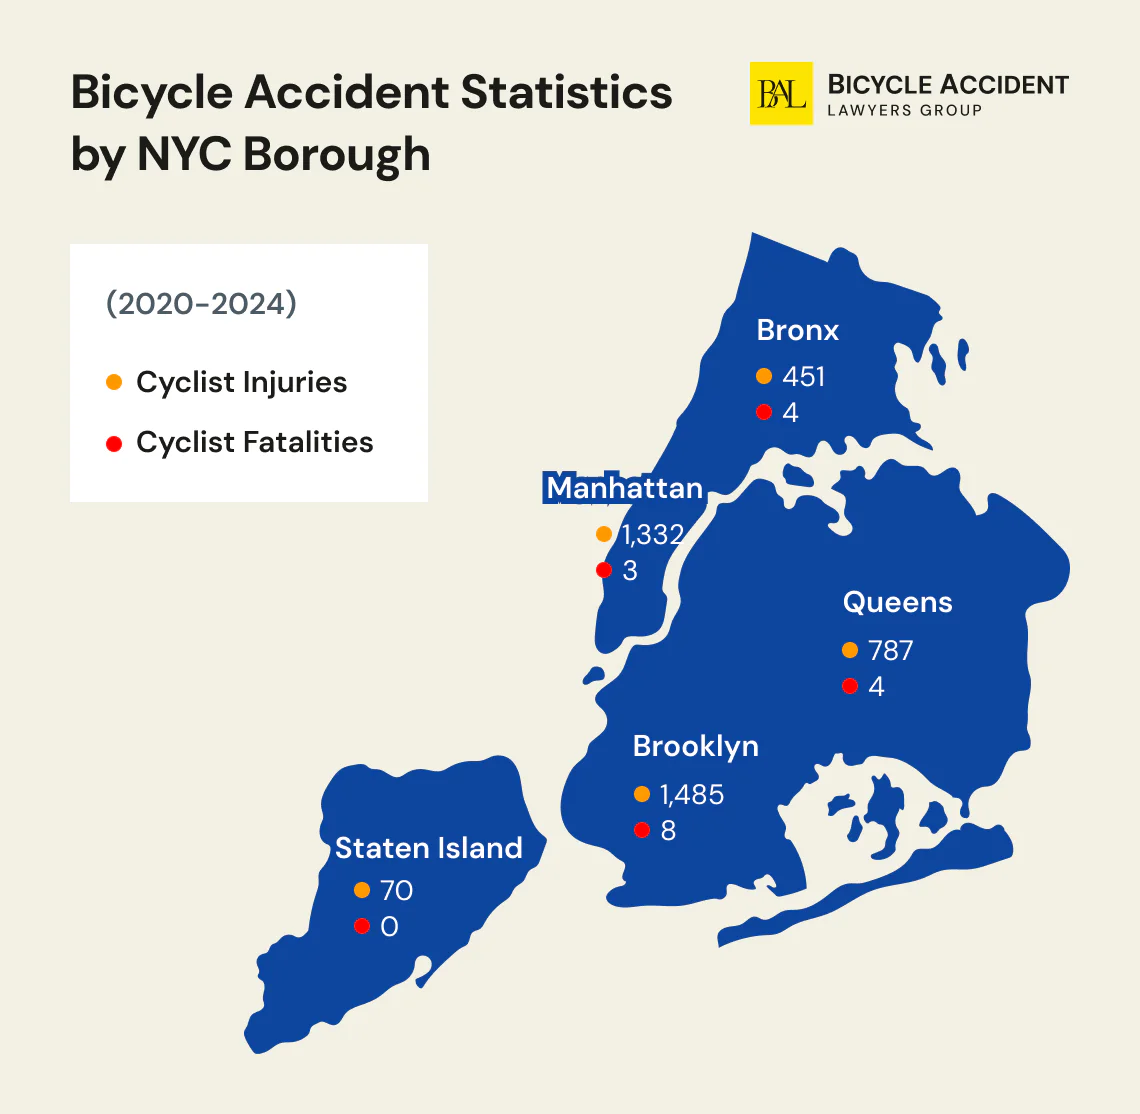
Manhattan led NYC cyclist injuries in 2025 with 1,510 traditional-bicycle injuries in DOT’s borough table, ahead of Brooklyn’s 1,428, Queens’ 913, the Bronx’s 464 and Staten Island’s 88, and only motorized two-wheelers flip that ranking. Cyclist deaths split along the same line, because DOT recorded 4 traditional-bicycle deaths citywide in 2025 and a motor vehicle did the killing in every one. Every borough figure below is computed the same way, one report, one filter, one year, so the comparisons are real, and DOT’s precinct rows land those figures on the neighborhoods and routes you ride.
Manhattan Bicycle Accident Statistics
Manhattan’s 1,510 injuries came out of 1,407 reported crashes with motor vehicles. On motorized two-wheelers it runs well behind Brooklyn and Queens, with 749 injuries and 10 fatalities.
Bronx Bicycle Accident Statistics
Fourth place on traditional bikes belongs to the Bronx, which logged 464 injuries out of 466 reported crashes. That near one-to-one ratio means almost every crash the borough reported put someone in the injury column.
Brooklyn Bicycle Accident Statistics
Brooklyn runs second on traditional bikes and first on anything with a motor, including 2,040 motorized two-wheeler injuries and 18 riders who died. Its 1,363 reported crashes with motor vehicles land only 44 behind Manhattan’s, so the two boroughs separate by a hair on traditional bikes and by a wide margin once motors enter the count.
Queens Bicycle Accident Statistics
Third on traditional bikes is Queens with 913 injuries out of 864 reported crashes. Its 1,338 motorized two-wheeler injuries killed 20 riders, the highest death count of any borough.
Staten Island Bicycle Accident Statistics
Staten Island recorded just 88 injuries, a low count that reflects thin ridership rather than safe streets. Its injuries and its reported crashes both come to 88, the only borough where those two lines meet.
NYC Bicycle Accident Statistics by the Season
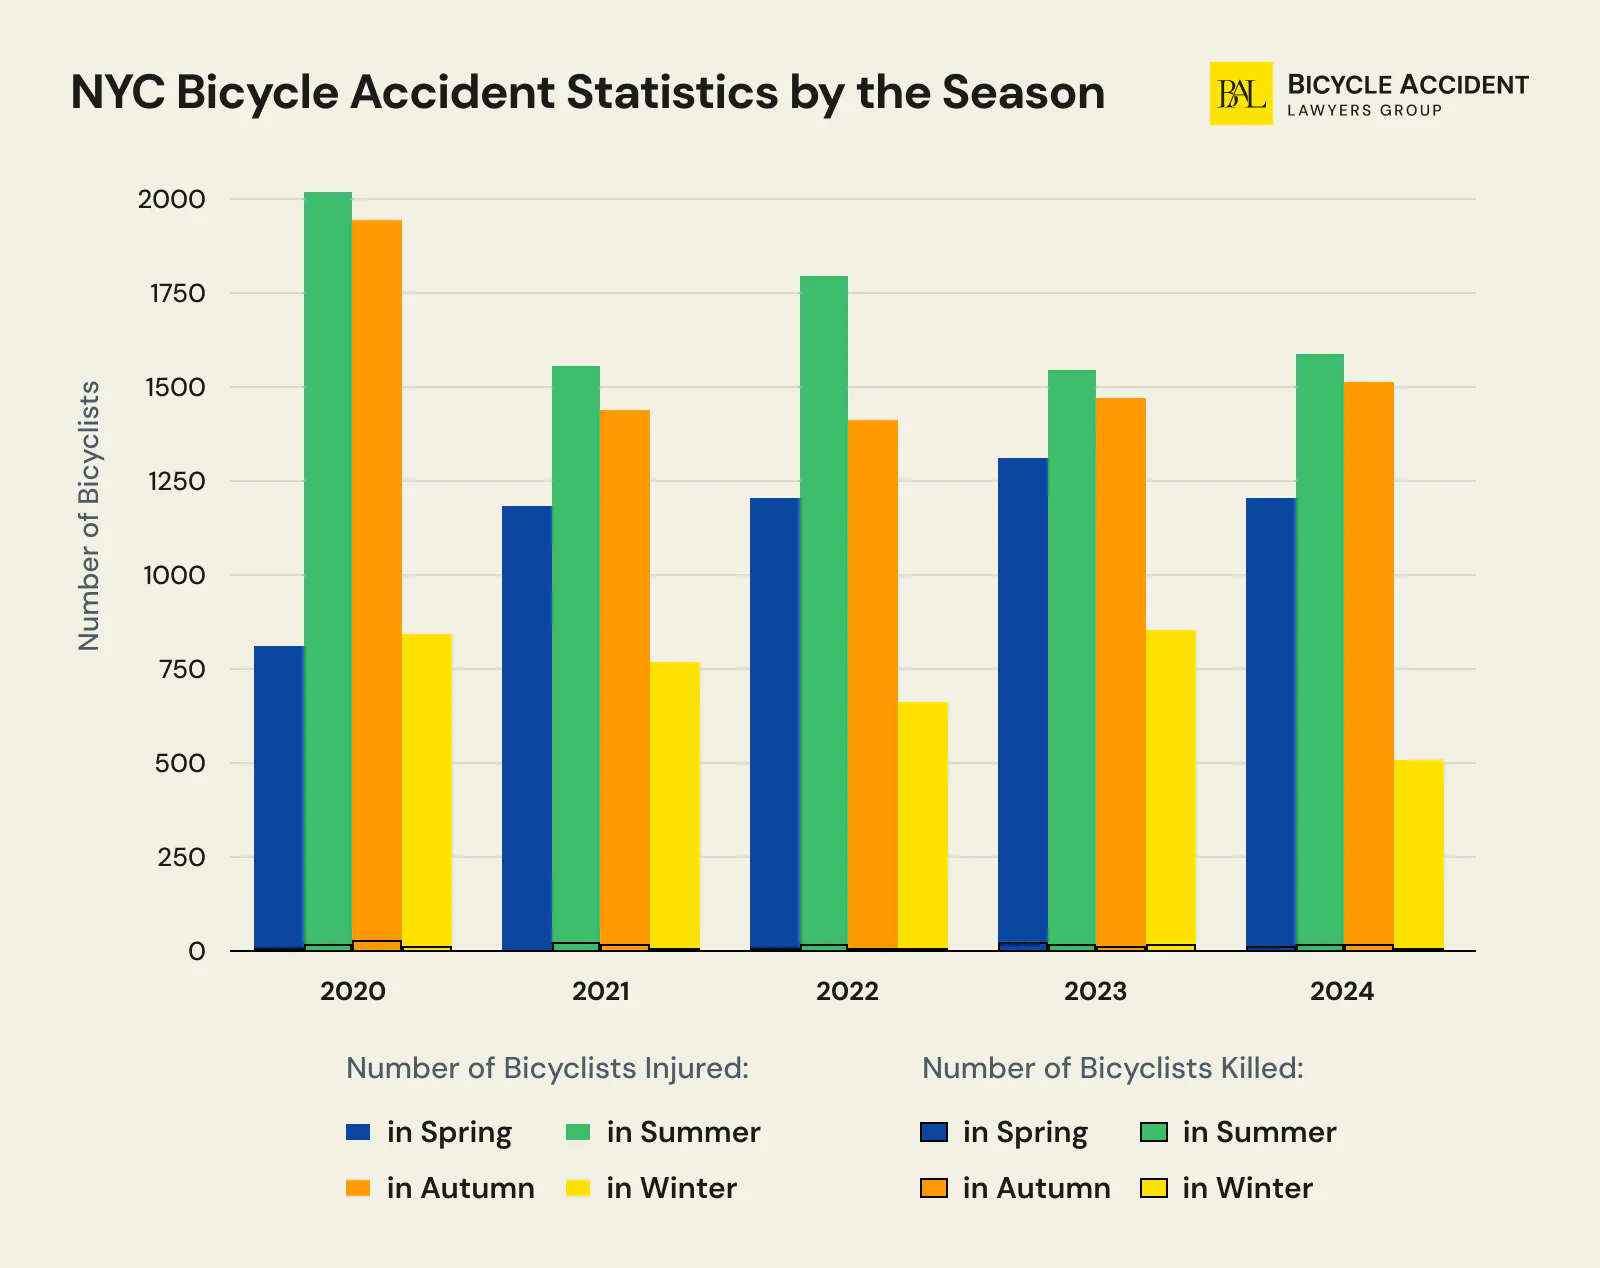
Summer is the most dangerous time of year for NYC cyclists: 33% of injuries and almost 35% of fatalities happen during this season. Winter is the least dangerous season, probably due to lower ridership.
Statistics provided by the NYPD from 2020 to 2024 show the following trends:
| Season | Average Injuries % | Average Fatalities % |
| Spring | 22.3% | 17.5% |
| Summer | 33.6% | 34.8% |
| Fall | 30.1% | 29.6% |
| Winter | 14% | 18.1% |
This table compares the number of riders injured and killed in each season year by year:
| Season | Average Injuries % | Average Fatalities % |
| Spring | 22.3% | 17.5% |
| Summer | 33.6% | 34.8% |
| Fall | 30.1% | 29.6% |
| Winter | 14% | 18.1% |
NYC Bicycle Crashes by Time of Day
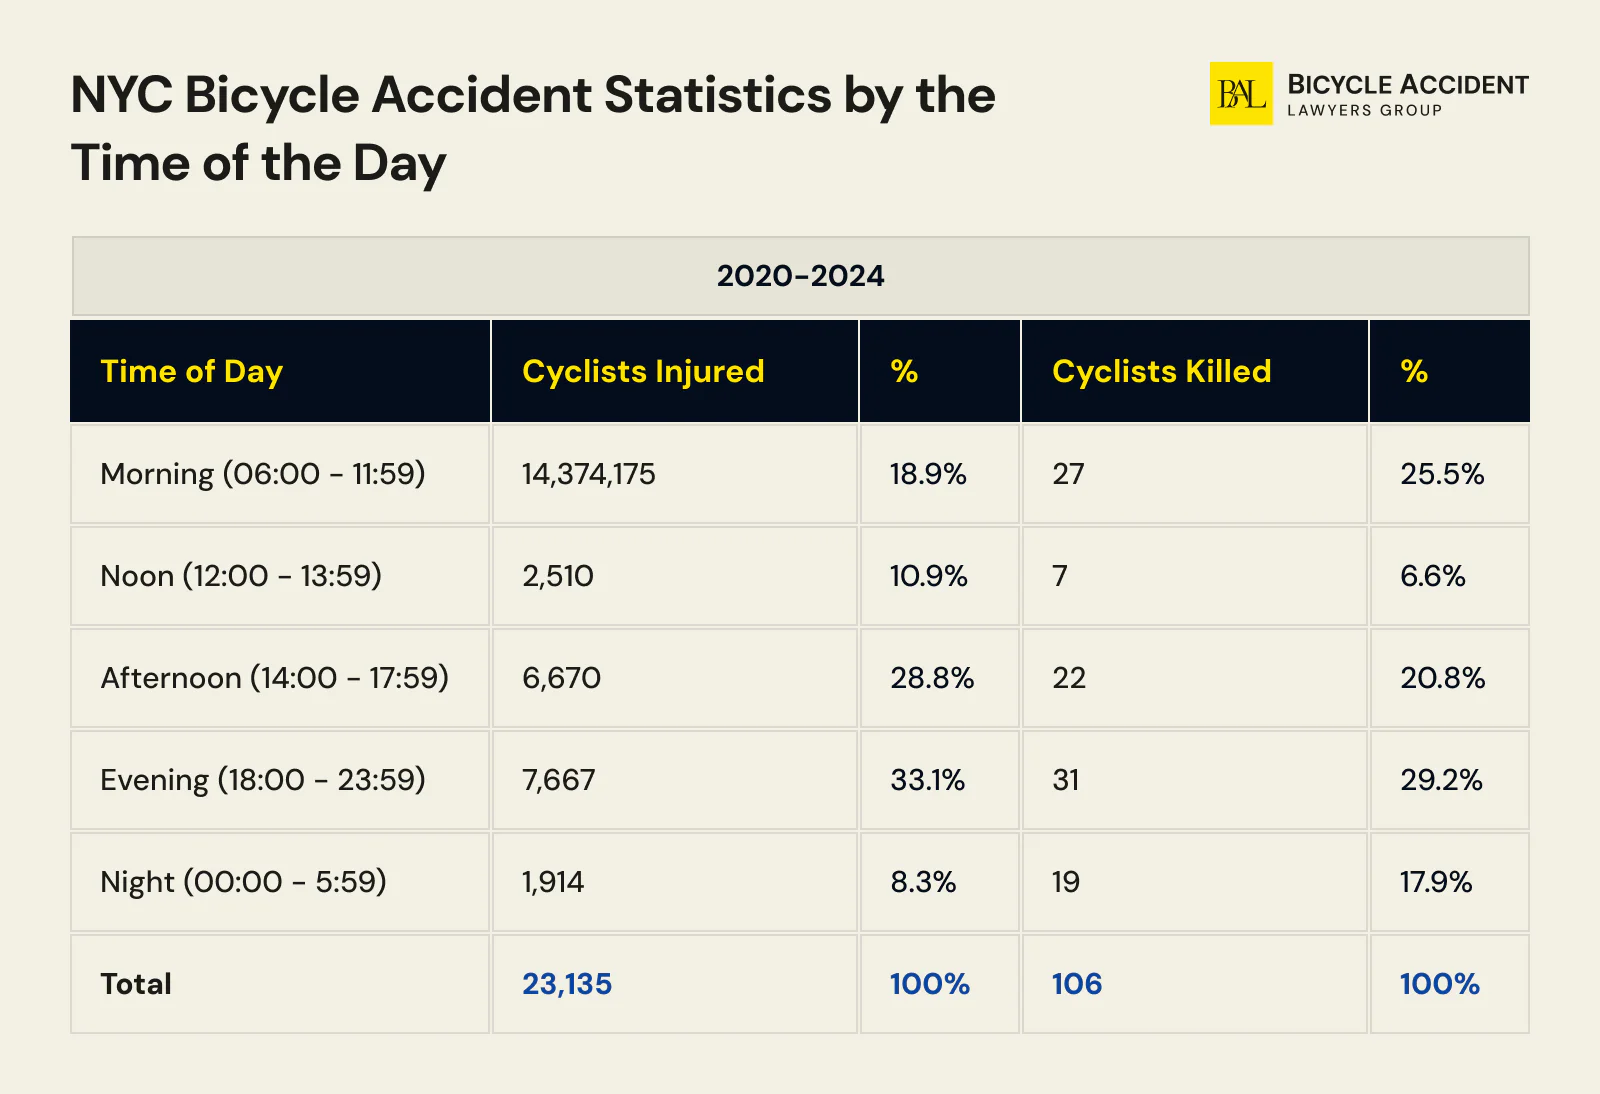
Traffic is more active during certain times of the day, so logically, more traffic collisions happen during rush hours. This also applies to bicycle crashes. Over 30% of NYC cyclists who were seriously or fatally injured were riding in the evening, from 6 p.m. to midnight. Noon and night hours are relatively safe for bike riders; they see the lowest injury and fatality rates. This is based on data from 2020 to 2024:
| Time of Day | Cyclists Injured | % | Cyclists Killed | % |
| Morning (06:00 a.m. – 11:59 a.m.) | 4,374 | 18.9% | 27 | 25.5% |
| Noon (12:00 p.m. – 1:59 p.m.) | 2,510 | 10.9% | 7 | 6.6% |
| Afternoon (2:00 p.m. – 5:59 p.m.) | 6,670 | 28.8% | 22 | 20.8% |
| Evening (6:00 p.m. – 11:59 p.m.) | 7,667 | 33.1% | 31 | 29.2% |
| Night (12:00 a.m. – 5:59 a.m.) | 1,914 | 8.3% | 19 | 17.9% |
| Total | 23,135 | 100% | 106 | 100% |
Helmet Use Among NYC Cyclists
In 2021, 1,455 cyclists who were involved in a biking crash across the state were wearing helmets. There were seven fatalities, and 121 of the reported crashes resulted in severe injuries. Out of 3,946 riders who weren’t wearing a helmet, 32 suffered fatal injuries and 378 experienced severe injuries. This was reported by the Institute for Traffic Safety Management and Research (ITSMR).
Another study analyzed helmet usage specifically among New York City cyclists:
- Only half of the observed riders were wearing helmets.
- Men are more likely to wear helmets than women.
- Around 20% of bike renters tend to wear helmets in NYC. Due to the lower rates of helmet usage, riders in Citi Bike accidents have a higher risk of head injury.
Remember: a helmet can reduce your chances of getting killed or seriously harmed in a bicycle collision by 34%.
NYC Bicycle Accidents by Vehicle Type
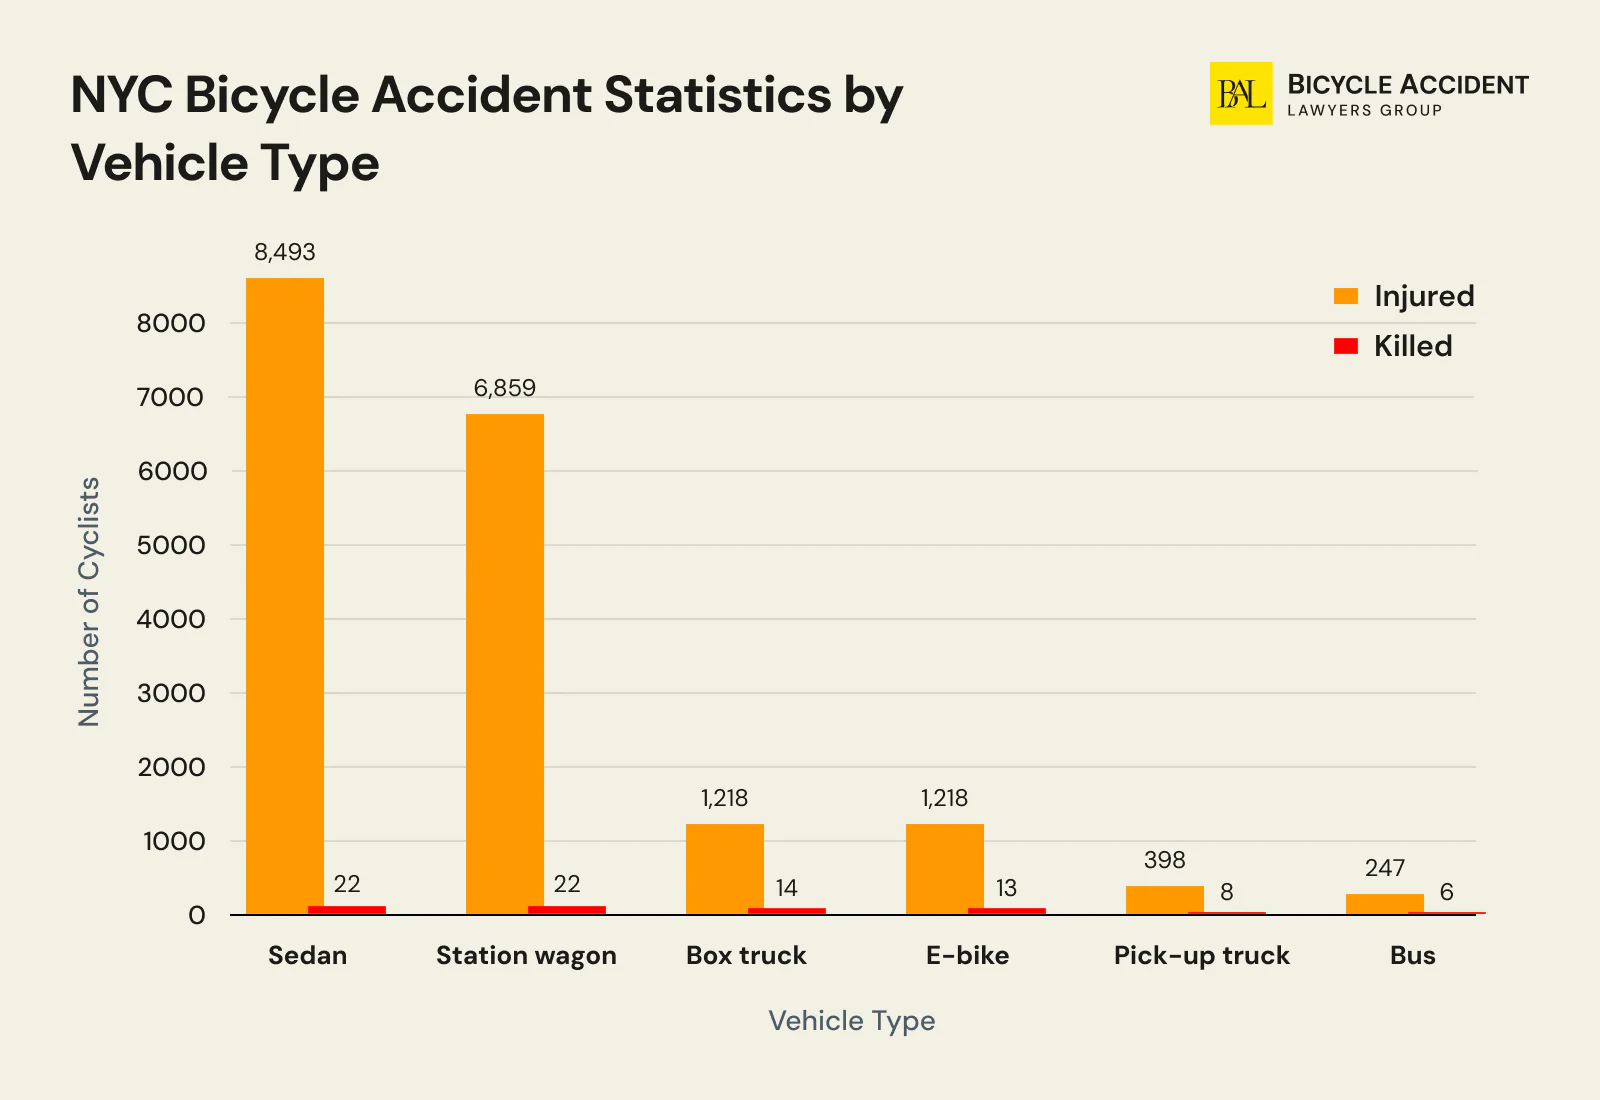
The majority of NYC crashes involving bicycle riders in recent years were caused by sedans and station wagons. Based on data from 2020 to 2024, these are the five most common vehicle types involved in bike collisions:
| Vehicle Type | Number of Cyclists Injured | Number of Cyclists Killed |
| Sedan | 8,493 | 22 |
| Station wagon | 6,859 | 22 |
| Box truck | 1,218 | 14 |
| E-bike | 1,218 | 13 |
| Pick-up truck | 398 | 8 |
| Bus | 247 | 6 |
Recovering Compensation After an NYC Bicycle Accident
Over the last decade, 19 New York City cyclists lost their lives in accidents on average per year. Statistics show that most of the collisions involving riders are caused by negligent motor vehicle drivers.
If you or your loved one got into a crash while riding your bike in NYC and someone else was at fault, you can recover compensation for physical injury, emotional trauma, and financial expenses. To assess the potential worth of your claim, you can use our bicycle accident settlement calculator. Under New York’s comparative negligence rules, you may still receive compensation even if you share partial fault for the accident, as explained in comparative negligence in bicycle accidents.
Insurance companies often try to minimize payouts, but a committed New York City bicycle accident lawyer can advocate for your rights and help you secure maximum compensation. Contact our team for a free consultation, and we’ll provide you with the best legal support you deserve!
Got more questions?
How many cyclists are killed in NYC each year?
For 2025 the answer is 4, 21 or 23, and all three are official. DOT’s Local Law 13 report puts 4 of those riders on traditional bicycles and files 17 more one line down as e-bike riders under motorized two-wheelers, which makes 21. The NYPD collision dataset reaches 23 because its cyclist field counts both machines together. Pick one series and name it.
Are e-bike deaths counted as cyclist deaths?
DOT files them under motorized two-wheelers and NYPD counts them in its cyclist field. For 2025 DOT recorded 17 e-bike deaths alongside 4 traditional-bicycle deaths, and NYPD’s combined field recorded 23.
How safe is riding a bike in NYC?
The city’s published rate is 17.1 bicyclist deaths and severe injuries per 10 million trips for 2018, down from 23.5 in 2014 (NYC DOT). Over the same decade the city’s annual cycling trips grew to 226.3 million, with daily cycling up 64% between 2013 and 2023 (NYC DOT).
Are bicycle accidents common?
NYPD recorded 5,358 cyclists injured in 2025, about 15 people a day, against 226.3 million cycling trips a year. DOT counted a further 867 bicycle injuries that year in crashes with no motor vehicle involved, and the national picture is built from the same police-reported records.
Where do I check bicycle accidents in NYC today or yesterday?
Go straight to the crash-by-crash record for that information. The NYPD feed on NYC Open Data carries one row per crash and normally updates daily. That refresh is paused as of September 2026, so the newest rows stop at June 11.
What is the 75 percent rule in cycling?
The 75 percent rule is a training-intensity guideline, not a crash-risk measure. It tells riders to keep at least 75 percent of weekly miles or time at or below 75 percent of maximum heart rate. No NYC crash dataset uses it.
Can I trust the leading causes numbers?
Those figures are only usable with their data pull date attached. Counts such as 287 incidents of disregarded traffic control in 2024 come from the NYPD contributing-factor field. Cyclist error, such as breaking traffic laws, sits in that field too, coded far less often than driver inattention, so police coding rarely points at the rider. Check the year and filter before repeating any bicycle crashes figure.
Sources
Bicycle Crash Data Reports:
Other sources:
- As NYPD’s Criminal Crackdown on Cyclists Expands, It Grows More Absurd: Victims
- Bicycle helmets – To wear or not to wear? A meta-analysis of the effects of bicycle helmets on injuries
- Bicycle Ridership Over East River Bridges Reaches All-Time High for Fourth Straight Year
- Bike Network and Ridership
- Consumer Alert: The NYS Division of Consumer Protection Reminds New Yorkers to Wear Their Bike Helmets
- IIHS: Fatality Facts 2023 — Bicyclists
- Helmet use among cyclists in New York City
- NHTSA: Traffic Safety Facts 2022 Data — Bicyclists and Other Cyclists
- NHTSA: Traffic Safety Facts 2023 Data — Bicyclists and Other Cyclists
- NYC OpenData: Motor Vehicle Collisions
- NYC Streets Plan
- PeopleForBikes’ 2025 City Ratings
- Priority Bicycle Districts
- Statista: Number of people participating in cycling in the United States from 2018 to 2024
- Transportation Alternatives
- Vision Zero in New York City
- Vision Zero View

Robert Goldwater is a cyclist representing cyclists. He has practiced personal injury and wrongful death law for more than 20 years, graduating with Honors from Arizona State University Law School, and has helped recover over $1 billion for clients, including injured cyclists.