

In 2025, Georgia recorded 31 bicycle fatalities, up from 23 cyclist deaths in 2023, according to the state’s live crash dashboard. In the most recent full statewide fact sheet, Georgia reported 921 bicycle crashes, 23 cyclist fatalities, and 140 serious or fatal injury crashes in 2023.
These numbers show more than crash volume. They show where cyclist risk is concentrated, how fatal outcomes are changing, and why Georgia remains a meaningful case study in bicycle safety. Understanding the latest Georgia bicycle accident statistics helps identify the highest-risk locations, the most vulnerable rider groups, and the patterns behind serious injury and fatal crashes.
- Key Georgia Bicycle Accident Statistics
- A Decade of Bicycle Accidents in Georgia: The Story of Numbers
- Bicycle Accidents in Georgia: County-by-County
- Bicycle Accidents in Georgia: Does Gender Affect the Rates?
- Bicycle Accidents in Georgia: Age Risk
- Statistics of Bicycle Accidents in Georgia: Common Causes
- Bicycle Accidents in Georgia: Dangerous Light Conditions
- Georgia Bicycle Accident Statistics: Types of Road
- Georgia Bicycle Accident Statistics: Urban vs. Rural Counties
- Georgia Bicycle Accident Statistics: Injury Severity Levels
- Georgia Bicycle Accident Statistics: Time-of-Day Trends
- Georgia Bicycle Accident Statistics: Day-of-Week Patterns
- Georgia Bicycle Accident Statistics: Seasonal Trends
- Georgia Bicycle Accident Statistics: Helmet Use
- Hotspots for Bicycle Crashes in Atlanta
- Georgia vs. National Bicycle Accident Comparison
- Final Thoughts on Bicycle Accident Statistics in Georgia
- Data Sources
- Get a FREE case evaluation today
Key Georgia Bicycle Accident Statistics
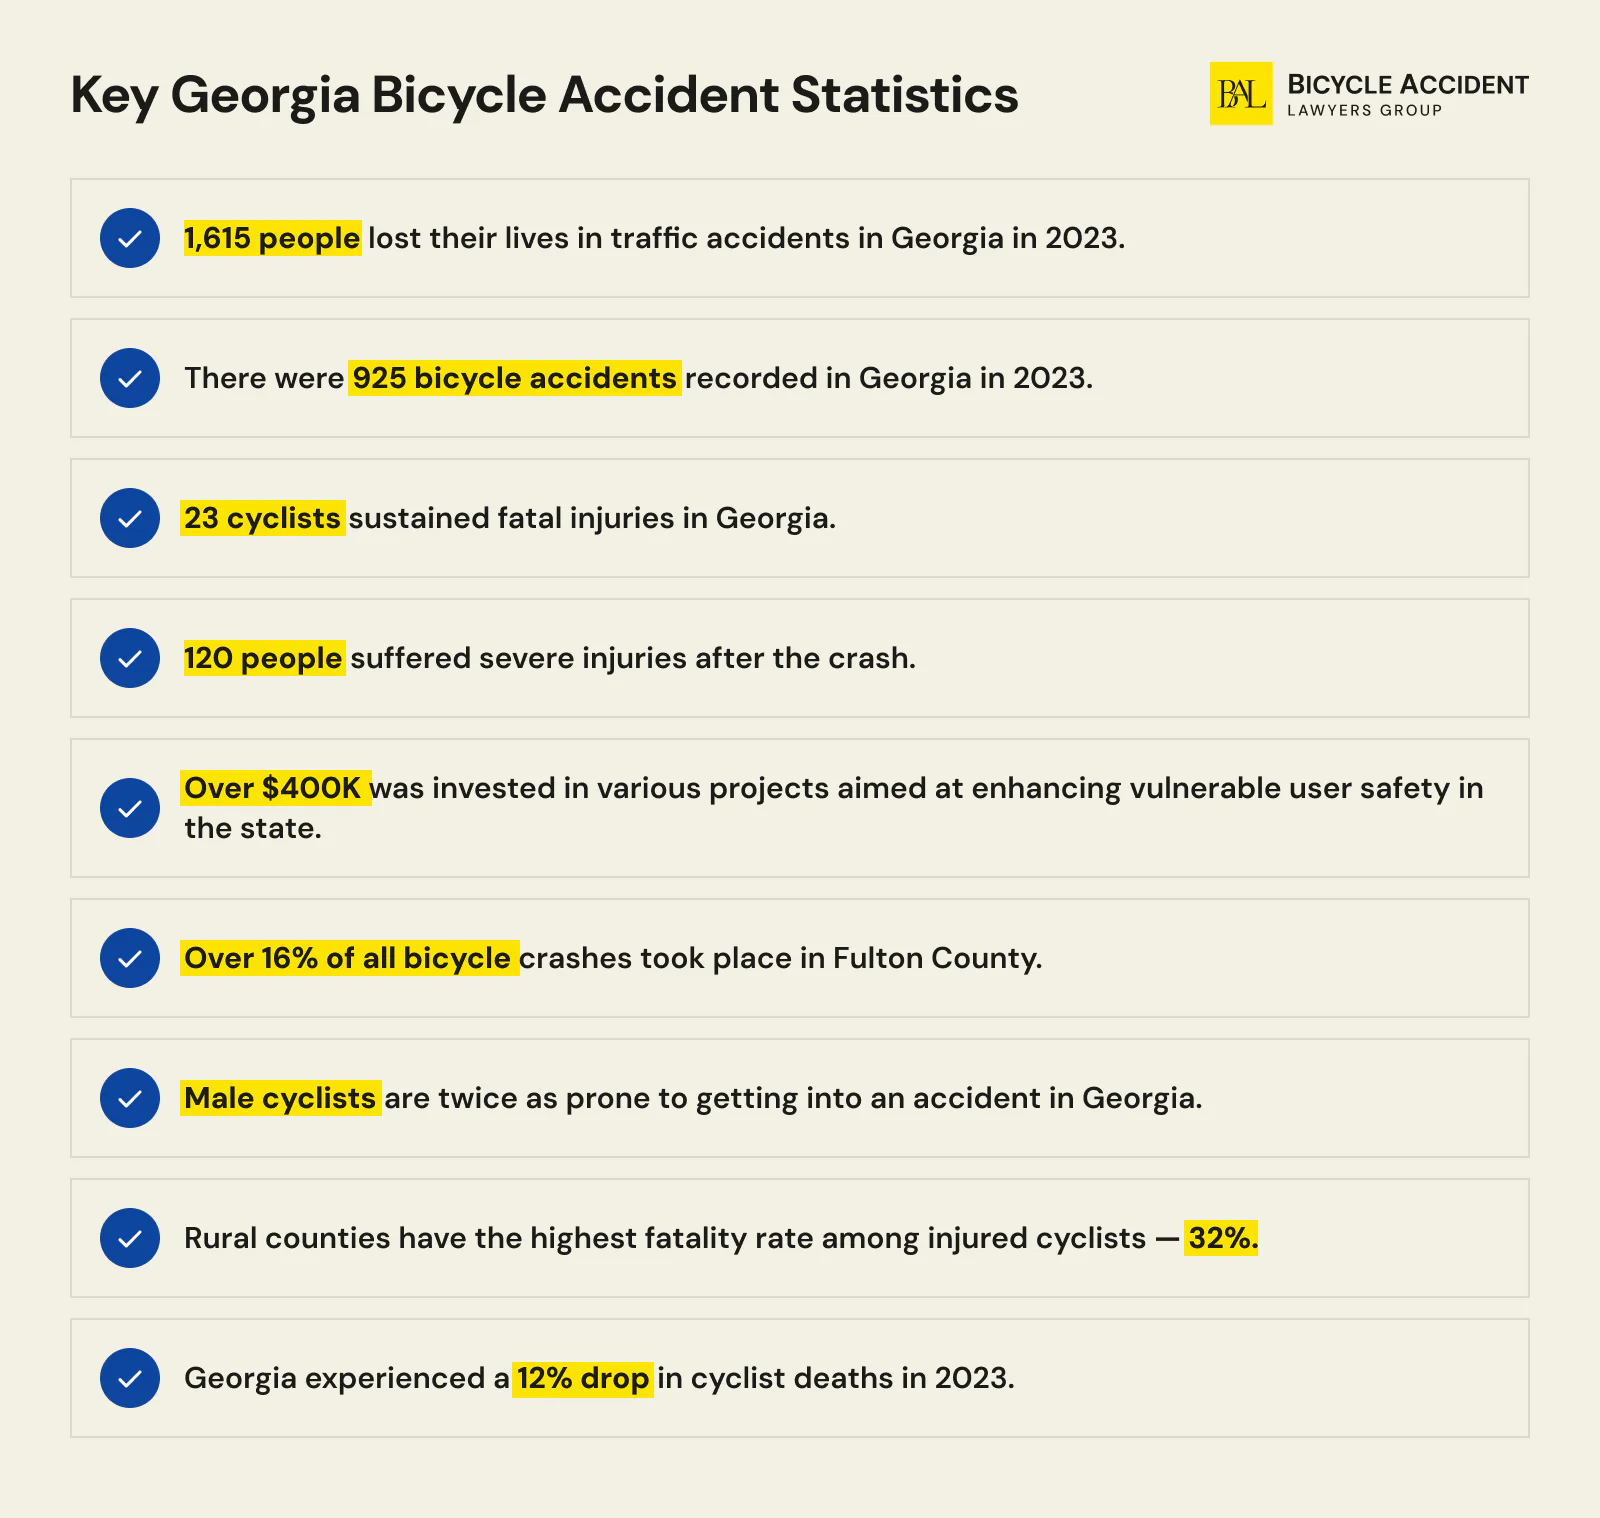
- Georgia recorded 925 bicycle crashes in 2023, resulting in 23 cyclist fatalities and 140 serious injuries, according to Georgia Bikes crash data.
- 1,615 people were killed in all traffic crashes across Georgia in 2023. Bicycle fatalities accounted for approximately 1.4% of that total.
- Bicycle fatalities have increased approximately 283% over the past decade, from 6 deaths in 2014 to 25 in 2024. The 2022 figure of 29 remains the deadliest single year on record.
- Preliminary 2025 data from the Georgia Bikes crash dashboard indicates 31 bicyclist fatalities, suggesting the long-term upward trend is continuing.
Injury Severity and Cost
- In 2023, 140 bicycle crashes in Georgia involved a serious or fatal injury, approximately 15% of all recorded crashes.
- Hospitalization and emergency room charges for injured cyclists totaled approximately $74.5 million in 2022, according to the Georgia Governor’s Office of Highway Safety.
Location and Crash Concentration
- Urban areas, including the Atlanta Region, accounted for 836 of 925 bicycle crashes in 2023, or approximately 91% of the statewide total. The Atlanta Region alone produced 430 crashes, 47% of all bicycle incidents in the state.
- Rural bicycle crashes are far less frequent but far more dangerous: 24% of rural crashes resulted in a serious or fatal injury, compared with 12% in the Atlanta Region and 17% in other urban counties.
Recent Trend
- Georgia recorded 23 cyclist deaths in 2023, down from 29 in 2022. However, preliminary 2024 data shows 31 fatalities, indicating that the single-year improvement did not hold.
A Decade of Bicycle Accidents in Georgia: The Story of Numbers
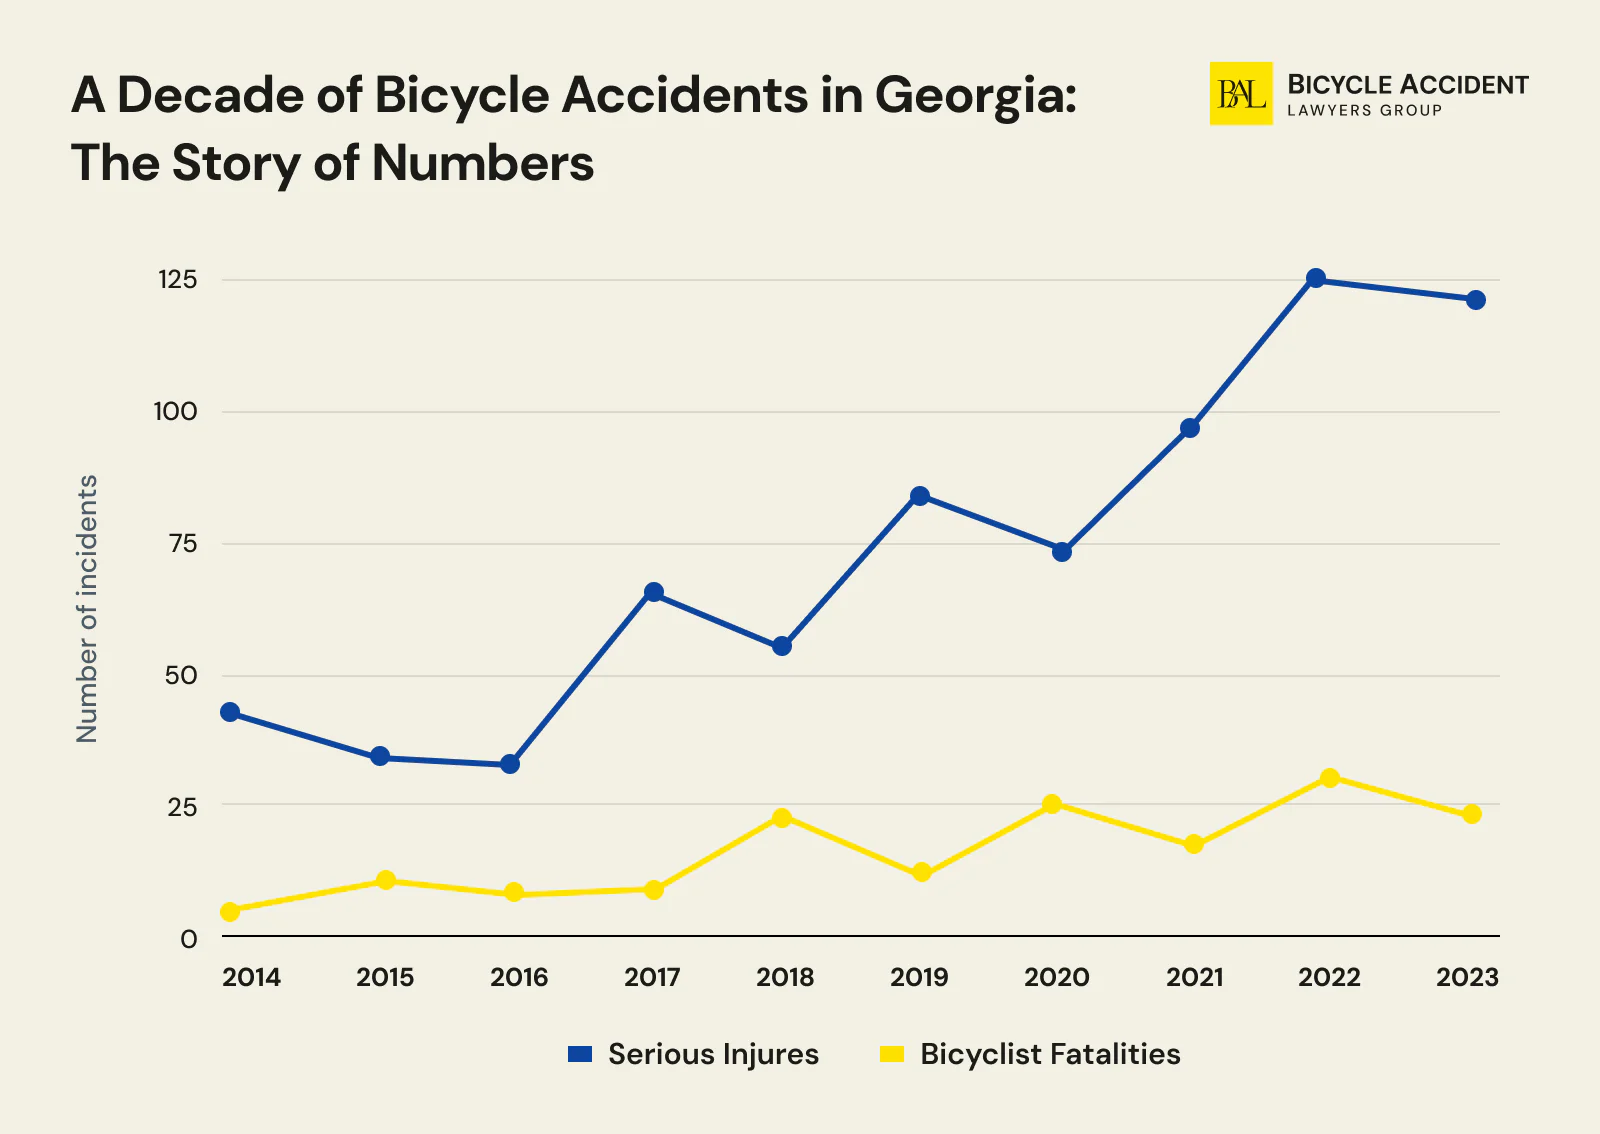
Almost 7.5K bicycle accidents happened in Georgia over the decade, and 160 people lost their lives in those crashes. Overall, bicycle accidents have been on the rise over the decade. From 2014 to 2023, bike crashes grew by 40%, and 2022 was the deadliest in the decade. Bicycle fatalities increased approximately 283% over the same period, from 6 deaths in 2014 to 23 in 2023, with a peak of 29 in 2022.
| Year | Total bicycle crashes | Serious injuries | Bicyclist fatalities |
| 2014 | 661 | 44 | 6 |
| 2015 | 706 | 34 | 11 |
| 2016 | 696 | 32 | 8 |
| 2017 | 688 | 65 | 9 |
| 2018 | 749 | 55 | 22 |
| 2019 | 786 | 89 | 12 |
| 2020 | 656 | 73 | 25 |
| 2021 | 735 | 96 | 15 |
| 2022 | 830 | 125 | 29 |
| 2023 | 925 | 120 | 23 |
The decade-long data reveals a troubling divergence. While crash counts increased by 40%, fatalities surged by 283%, a rate far outpacing the crash growth itself. This pattern suggests that when bicycle accidents do occur in Georgia, they are becoming more lethal, likely due to higher vehicle speeds, heavier vehicles on the road, and gaps in protected cycling infrastructure. It mirrors the national trend, where US bicycle accident statistics show an 87% increase in cyclist fatalities since 2010.
Bicycle Accidents in Georgia: County-by-County
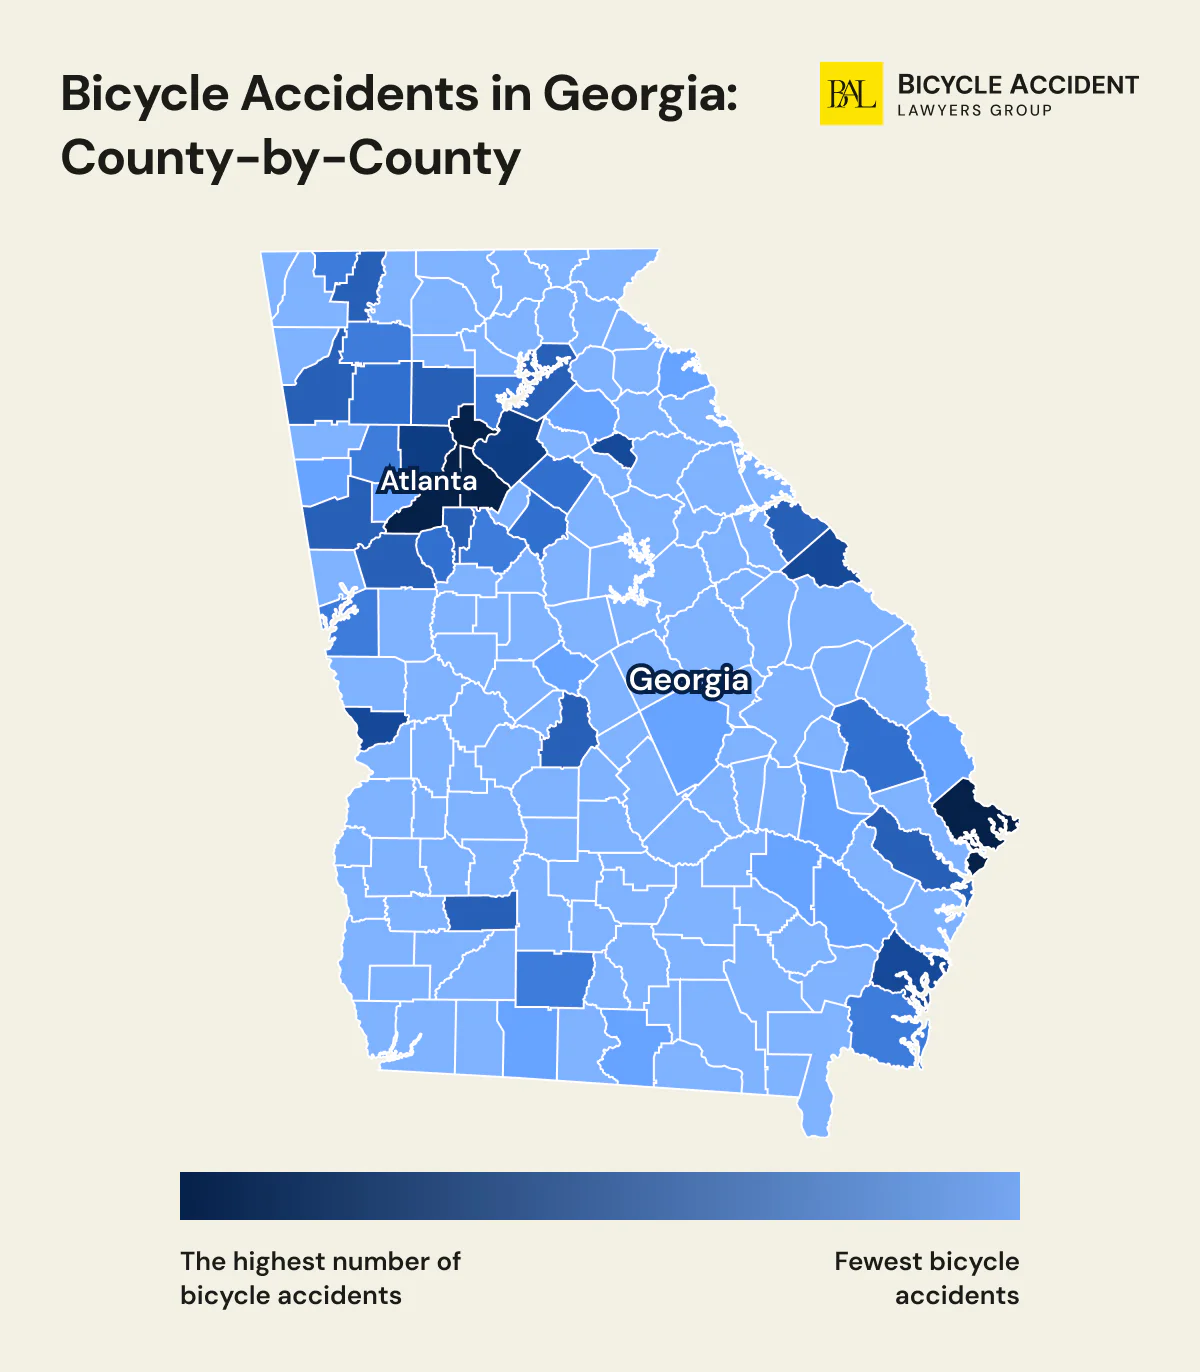
According to the recent survey, Fulton County is the most dangerous region, with 154 bicycle accidents occurring there in 2023. At the same time, Chatham and Richmond counties seem to be the deadliest, 8 people lost their lives there (4 fatalities each). Overall, it is safe to assume that metro areas pose a palpable threat to riders. However, in smaller counties like McIntosh and Pulaski, the death rate matches the crash rate, reflecting a 100% fatality score.
| County | Total bike crashes | Total bicyclist fatalities | Serious injuries |
| Appling | 3 | 0 | 1 |
| Atkinson | 2 | 0 | 0 |
| Bacon | 2 | 0 | 1 |
| Baldwin | 1 | 0 | 0 |
| Banks | 1 | 0 | 1 |
| Bartow | 11 | 0 | 1 |
| Ben Hill | 1 | 0 | 0 |
| Berrien | 1 | 0 | 0 |
| Bibb | 4 | 1 | 0 |
| Bleckley | 1 | 0 | 3 |
| Brantley | 1 | 0 | 0 |
| Bryan | 2 | 0 | 0 |
| Bulloch | 11 | 1 | 1 |
| Butts | 1 | 0 | 0 |
| Camden | 6 | 1 | 1 |
| Candler | 2 | 0 | 1 |
| Carroll | 14 | 0 | 3 |
| Catoosa | 5 | 0 | 0 |
| Charlton | 1 | 0 | 0 |
| Chatham | 98 | 4 | 13 |
| Cherokee | 15 | 0 | 2 |
| Clarke | 28 | 0 | 5 |
| Clayton | 18 | 0 | 5 |
| Cobb | 67 | 0 | 4 |
| Colquitt | 5 | 0 | 2 |
| Columbia | 9 | 0 | 1 |
| Cook | 1 | 0 | 1 |
| Coweta | 14 | 0 | 3 |
| Decatur | 2 | 0 | 0 |
| DeKalb | 85 | 2 | 5 |
| Dooly | 1 | 0 | 1 |
| Dougherty | 15 | 0 | 0 |
| Douglas | 4 | 0 | 1 |
| Effingham | 3 | 0 | 0 |
| Elbert | 2 | 0 | 1 |
| Evans | 1 | 0 | 0 |
| Fayette | 9 | 0 | 1 |
| Floyd | 14 | 1 | 5 |
| Forsyth | 6 | 0 | 1 |
| Fulton | 154 | 1 | 19 |
| Gilmer | 1 | 0 | 0 |
| Glynn | 21 | 0 | 2 |
| Gordon | 6 | 0 | 0 |
| Grady | 1 | 0 | 0 |
| Gwinnett | 56 | 3 | 7 |
| Habersham | 1 | 0 | 0 |
| Hall | 16 | 0 | 1 |
| Haralson | 3 | 0 | 0 |
| Hart | 3 | 0 | 0 |
| Henry | 6 | 0 | 1 |
| Houston | 14 | 1 | 1 |
| Jackson | 3 | 0 | 0 |
| Lamar | 2 | 0 | 0 |
| Laurens | 4 | 0 | 1 |
| Liberty | 10 | 0 | 0 |
| Lowndes | 3 | 0 | 0 |
| Lumpkin | 2 | 0 | 1 |
| Macon | 1 | 0 | 0 |
| MacDuffie | 1 | 1 | 0 |
| McIntosh | 1 | 1 | 0 |
| Mitchell | 1 | 0 | 1 |
| Monroe | 2 | 0 | 0 |
| Morgan | 1 | 0 | 0 |
| Murray | 1 | 0 | 0 |
| Muscogee | 24 | 0 | 3 |
| Newton | 7 | 1 | 2 |
| Oconee | 1 | 0 | 0 |
| Paulding | 7 | 0 | 1 |
| Peach | 1 | 0 | 0 |
| Polk | 2 | 0 | 0 |
| Pulaski | 1 | 1 | 0 |
| Richmond | 34 | 4 | 6 |
| Spalding | 1 | 0 | 1 |
| Stephens | 2 | 0 | 1 |
| Sumter | 1 | 0 | 0 |
| Tattnall | 3 | 0 | 1 |
| Thomas | 4 | 0 | 1 |
| Tift | 2 | 0 | 0 |
| Toombs | 2 | 0 | 0 |
| Troup | 7 | 0 | 1 |
| Union | 1 | 0 | 0 |
| Upson | 2 | 0 | 0 |
| Walker | 2 | 0 | 1 |
| Walton | 7 | 0 | 3 |
| Ware | 2 | 0 | 0 |
| Wayne | 3 | 0 | 0 |
| White | 2 | 0 | 0 |
| Whitfield | 10 | 0 | 1 |
Bicycle Accidents in Georgia: Does Gender Affect the Rates?
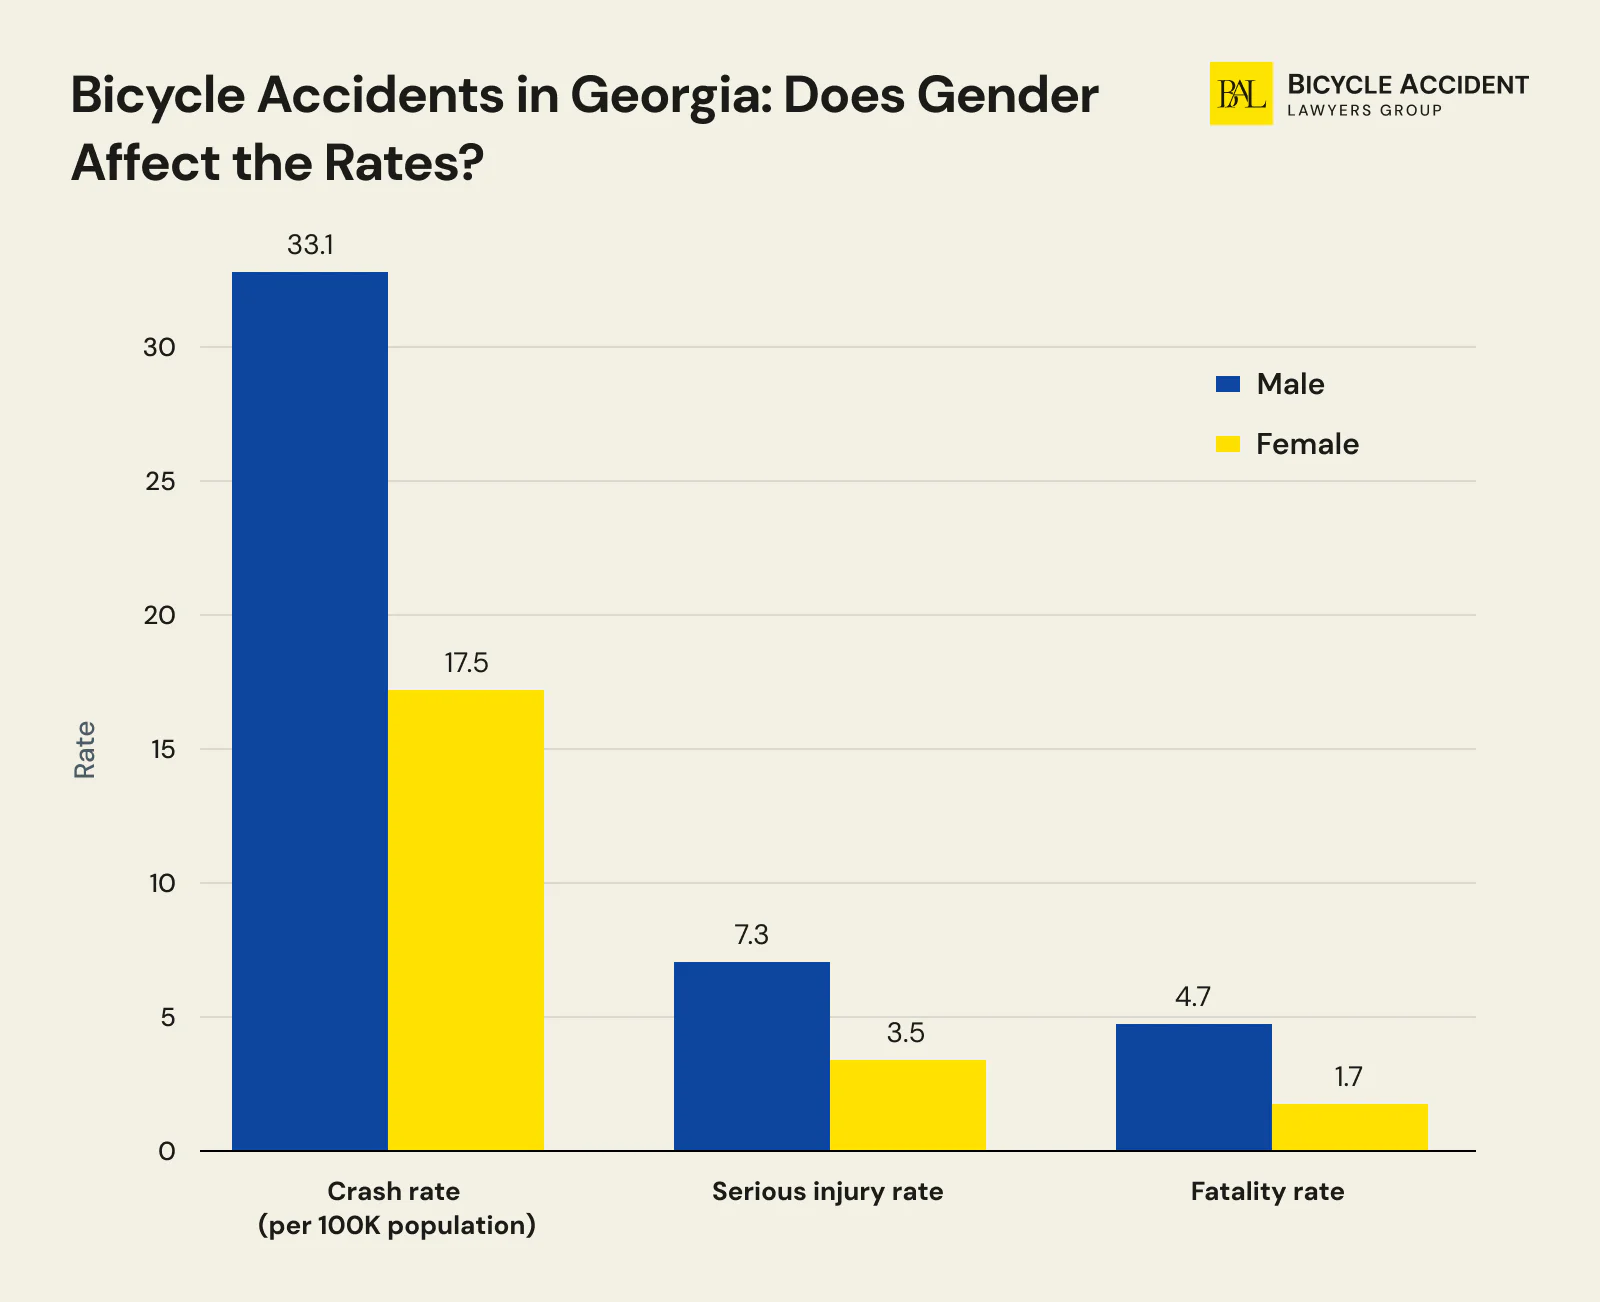
The recent data proves that the gender of bicyclists in Georgia has a palpable impact on overall accident statistics in the state and reflects several noticeable patterns. On average, bicycle accidents occur to male riders 1.9 times more often than to female bikers. Moreover, males are 2.8 times more likely to sustain fatal injuries in a bike crash. This aligns with the national pattern, where males account for approximately 89% of all bicycle deaths across the United States.
| Metric | Male bicyclists | Female cyclists |
| Crash rate per 100K population | 33.1 | 17.5 |
| Serious injury rate | 7.3 | 3.5 |
| Fatality rate | 4.7 | 1.7 |
These numbers point out a few critical issues to be handled on both the governmental and social levels. First of all, male cyclists may be prone to more risk-taking behavior, such as higher speeds, ignoring wearing helmets when riding, and choosing locations without designated bike lanes or other faulty infrastructure. This means that local authorities may want to consider spreading awareness about the topic, investing in gender-specific safety campaigns, improving biking infrastructure planning, and updating or strengthening existing Georgia bike laws.
Bicycle Accidents in Georgia: Age Risk
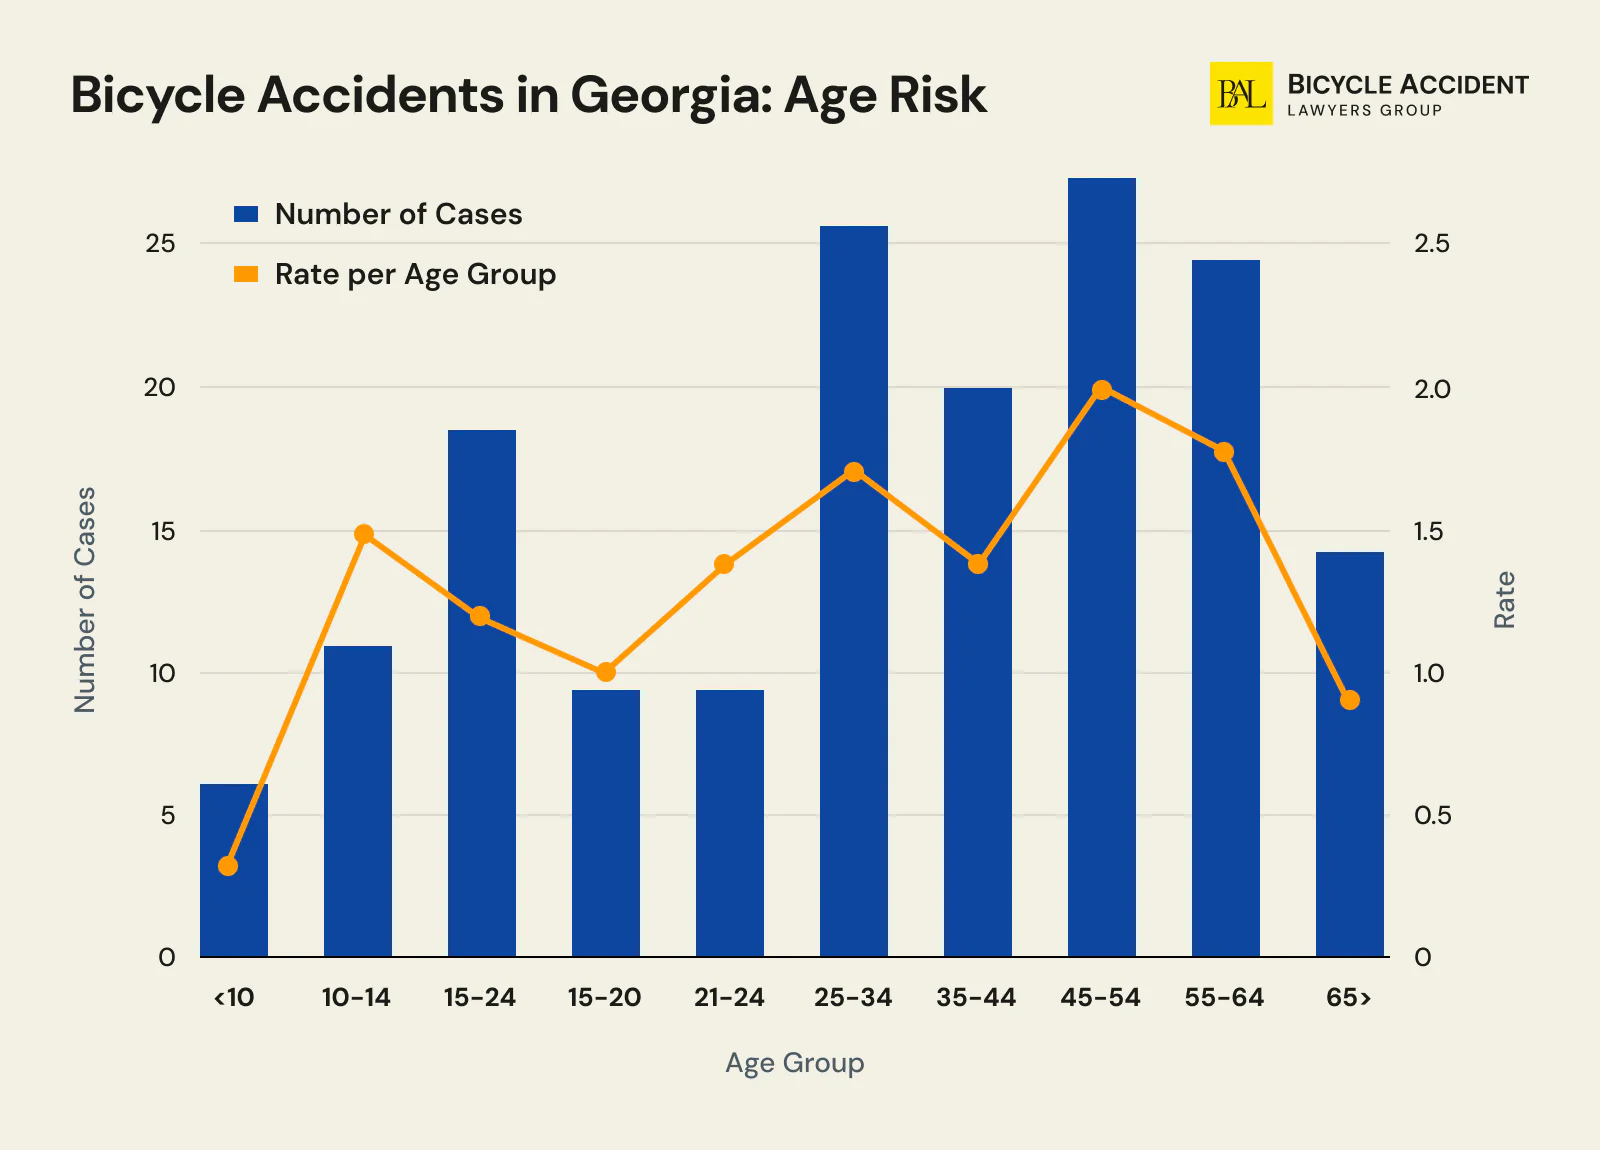
Serious or even deadly bicycle accidents among middle-aged adults are the most frequent in Georgia. Riders aged 45-64 show the highest crash rate, almost 2.00 per 1,000 cyclists. Such a trend may be inspired by a spike in recreational biking in the area.
Riders in their 20s and 30s also have a relatively high injury rate of 1.72 per 1,000 bicyclists. This means that young adults are actively using bicycles as the primary means of transportation, yet riding in urban areas poses a palpable threat to this age group.
Young children have the lowest injury rate. This may be because of a safer or supervised manner of cycling. Or, maybe because younger kids in Georgia don’t ride bikes as often.
These trends prove that age-targeted safety measures are to be enhanced in Georgia.
| Age | Number | % | Rate |
| <10 | 6 | 4% | 0.46 |
| 10-14 | 11 | 7% | 1.50 |
| 15-24 | 18 | 12% | 1.18 |
| 15-20 | 9 | 6% | 0.98 |
| 21-24 | 9 | 6% | 1.48 |
| 25-34 | 26 | 17% | 1.72 |
| 35-44 | 20 | 13% | 1.38 |
| 45-54 | 28 | 19% | 2.00 |
| 55-64 | 24 | 16% | 1.79 |
| 65> | 14 | 9% | 0.85 |
Statistics of Bicycle Accidents in Georgia: Common Causes
Most bicycle crashes happen because one of the parties involved misbehaved. Some actions or a lack of timely reactions lead to crashes with sometimes fatal consequences.
| Cause | Description |
| Distracted driving | A driver distracted by their device, scenery, or passengers may not notice the cyclist in time and cause a serious collision because of the lapse in attention. |
| Driving under the influence | Drugs and alcohol have an impairing effect on the drivers’ judgment as well as their reaction. |
| Failure to yield | According to modern Georgia law, drivers owe bicyclists the right of way. However, many motor vehicle operators either do not know about the right-of-way rule or choose to ignore it. Under O.C.G.A. 40-6-294, drivers must maintain a safe distance of at least three feet when passing a bicycle on the road. |
| Dooring | A suddenly opened car door can cause irreversible damage to a cyclist. Not only can a driver unwillingly harm the rider hit by a car door, but also can send the rider under the wheels of the approaching traffic, which may lead to a fatal outcome. |
| Speeding | Driving at high speed gives the driver little time to react and prevent a bike crash. |
| Poor riding conditions | Unpaved roads, potholes, and debris can interfere with the cyclist’s ability to control the vehicle and initiate a serious crash or collision. |
| Hit-and-run | Approximately 25% of all bicycle crashes in Georgia are hit-and-run incidents, where the driver flees the scene after striking a cyclist. These incidents are particularly dangerous because the injured rider may not receive timely medical attention. |
Bicycle Accidents in Georgia: Dangerous Light Conditions
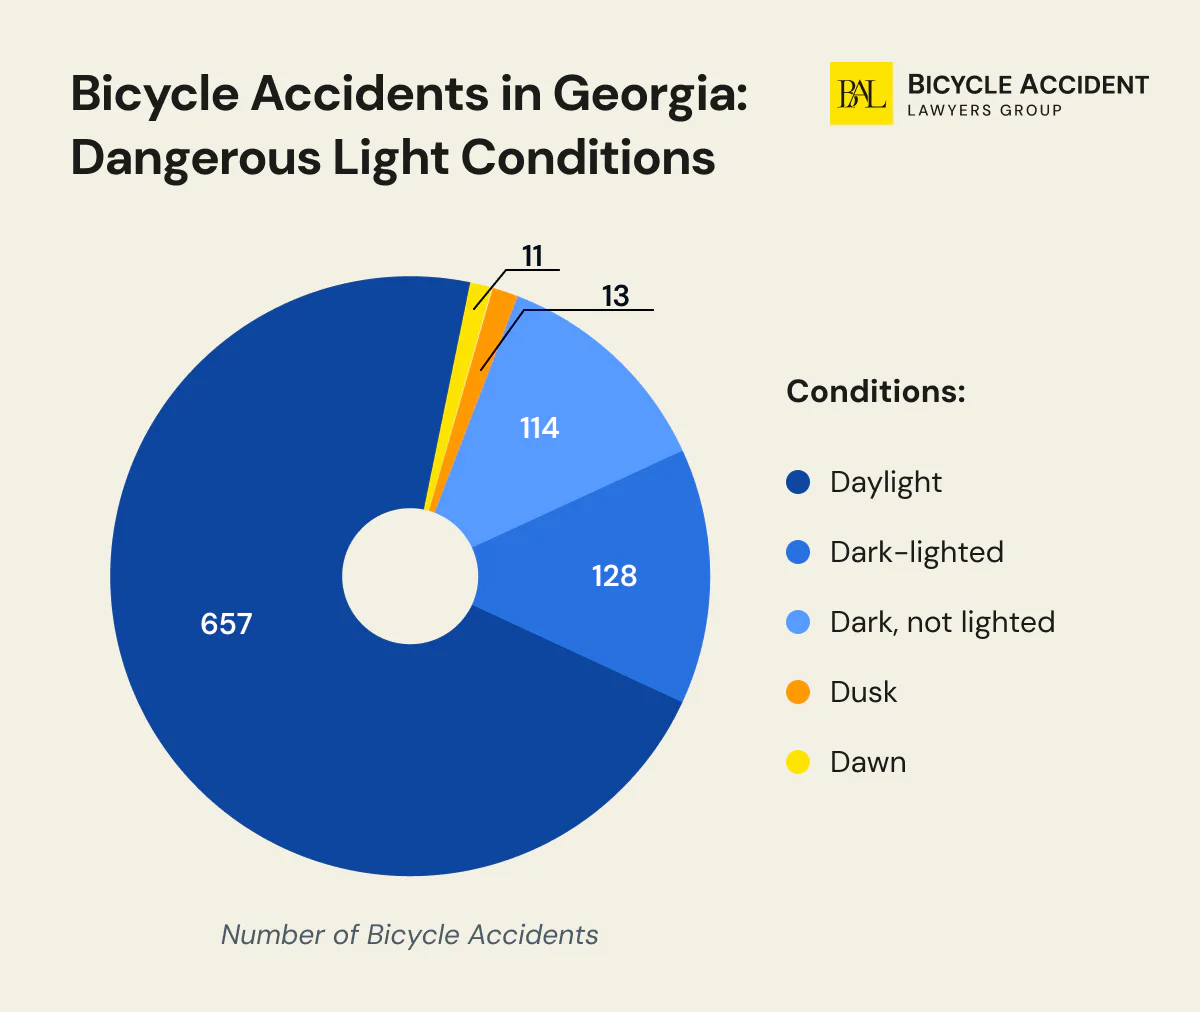
A recent survey shows that over 71% of all bicycle accidents in Georgia take place during daylight. Why is that? It seems that proper lighting must improve safety on the roads of the state. However, daylight implies heavier traffic, hence the numbers.
When dusk, dawn, and dark hours are combined, they account for approximately 29% of all bicycle crashes in Georgia. Both lighted and unlit areas of Georgia during the dark hours of the day pose an evident threat to bike riders. Although the overall percentage of bicycle accidents during nighttime remains below 15%, you must keep the number of bicyclists on the road in mind. While fewer people cycle during these parts of the day, they still face a high risk of sustaining serious, if not fatal, injuries. Nationally, over 56% of bicyclist fatalities occur during dusk, dawn, or nighttime hours, a figure that is likely similar in Georgia given the state’s comparable traffic patterns.
An average bike rider can lower the risk of getting into an accident if they equip their vehicles with proper reflective and lighting gear, wear bright clothes, and keep track of their surroundings at all times.
| Conditions | Number of bicycle accidents | % of bike crashes |
| Daylight | 657 | 71.03% |
| Dark-lighted | 128 | 13.84% |
| Dark, not lighted | 114 | 12.32% |
| Dusk | 13 | 1.41% |
| Dawn | 11 | 1.19% |
| Combined non-daylight | 266 | 28.76% |
Georgia Bicycle Accident Statistics: Types of Road
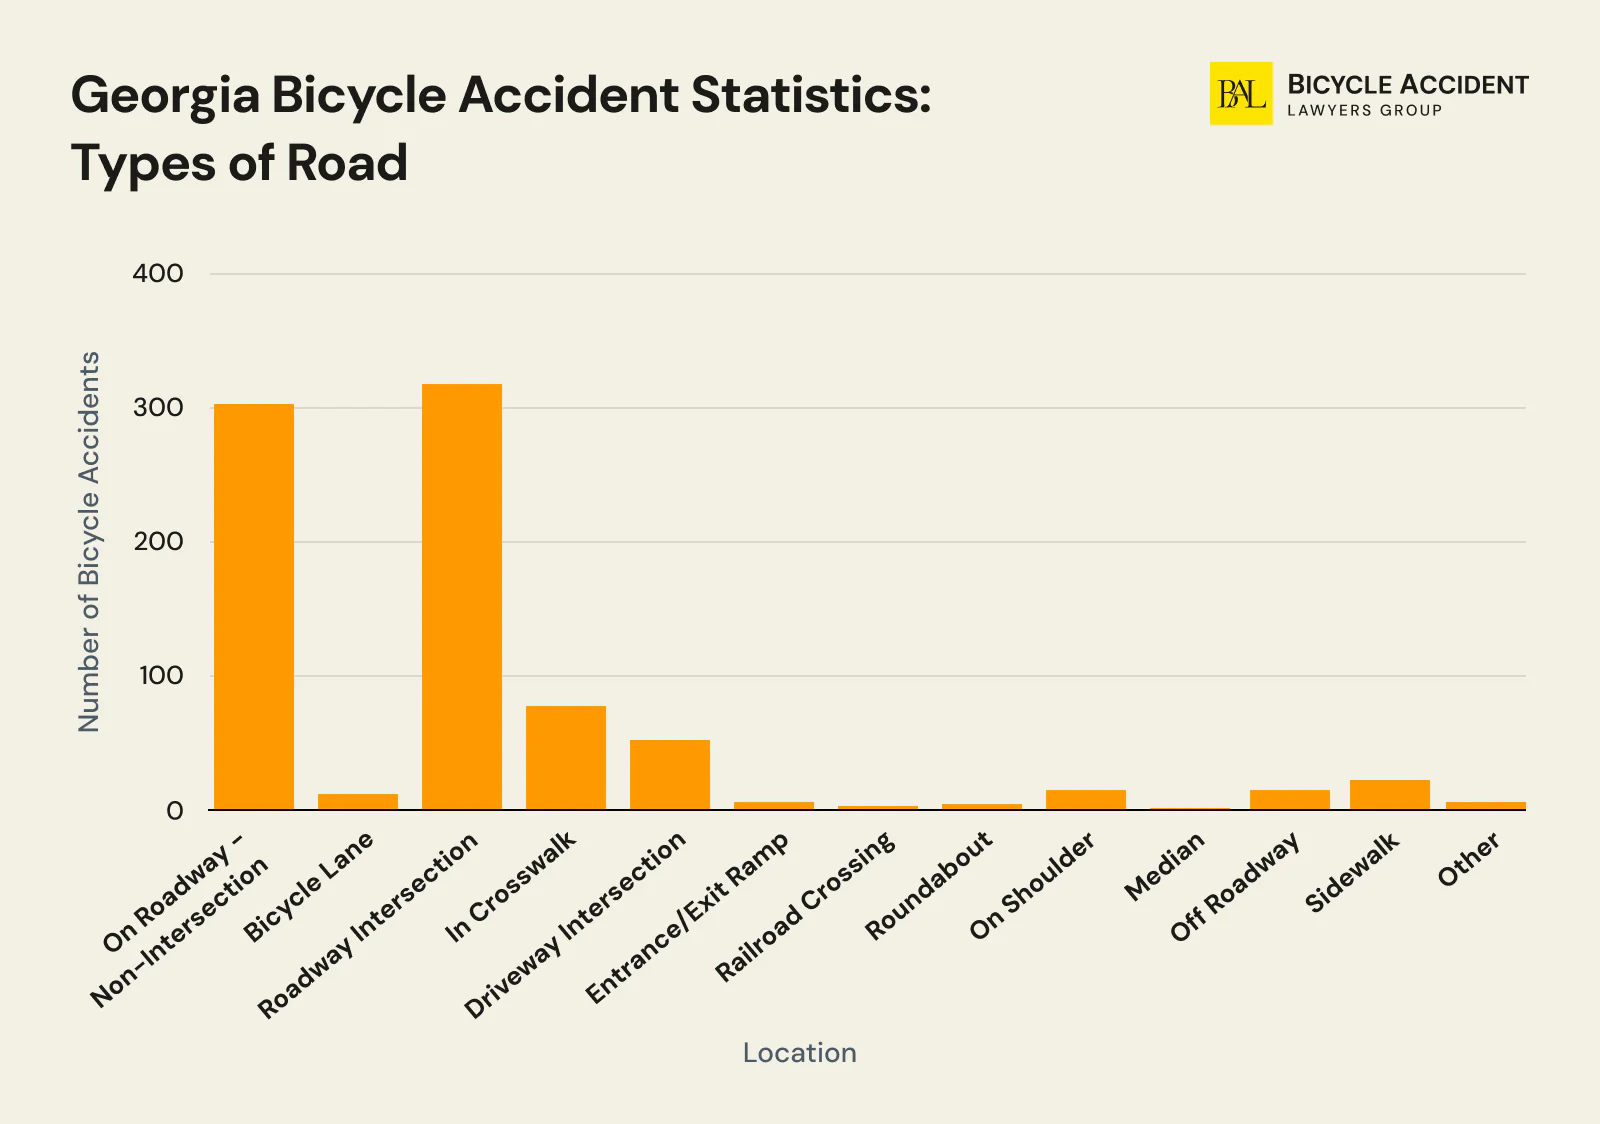
Over 55% of all bicycle accidents take place at or near intersections in Georgia, making intersection crashes the most common location type. However, the absence of intersections in the vicinity does not rule out the chance of an incident. On the contrary, 38% of bike crashes happen on straight, non-intersection parts of the road across the state. Interestingly, less than 5% of all bicycle accidents occurred in areas designed for vulnerable road user categories, such as a bike lane, shoulder, or sidewalk.
Hit-and-run accidents account for approximately 25% of all bicycle crashes in Georgia, and many of these incidents are not fully reflected in the location data below.
| Location | Number of bicycle accidents | % |
| Not at an intersection | 314 | 38% |
| On roadway, non-Intersection | 301 | 36% |
| Bicycle lane | 13 | 2% |
| At intersection | 458 | 55% |
| Roadway intersection | 318 | 38% |
| In crosswalk | 76 | 9% |
| Driveway intersection | 55 | 7% |
| Entrance/exit ramp | 4 | <1% |
| Railroad crossing | 2 | <1% |
| Roundabout | 3 | <1% |
| Roadside | 16 | 2% |
| On shoulder | 15 | 2% |
| Median | 1 | <1% |
| Off-roadway | 37 | 4% |
| Off roadway | 16 | 2% |
| Sidewalk | 21 | 3% |
| Other | 4 | <1% |
Georgia Bicycle Accident Statistics: Urban vs. Rural Counties
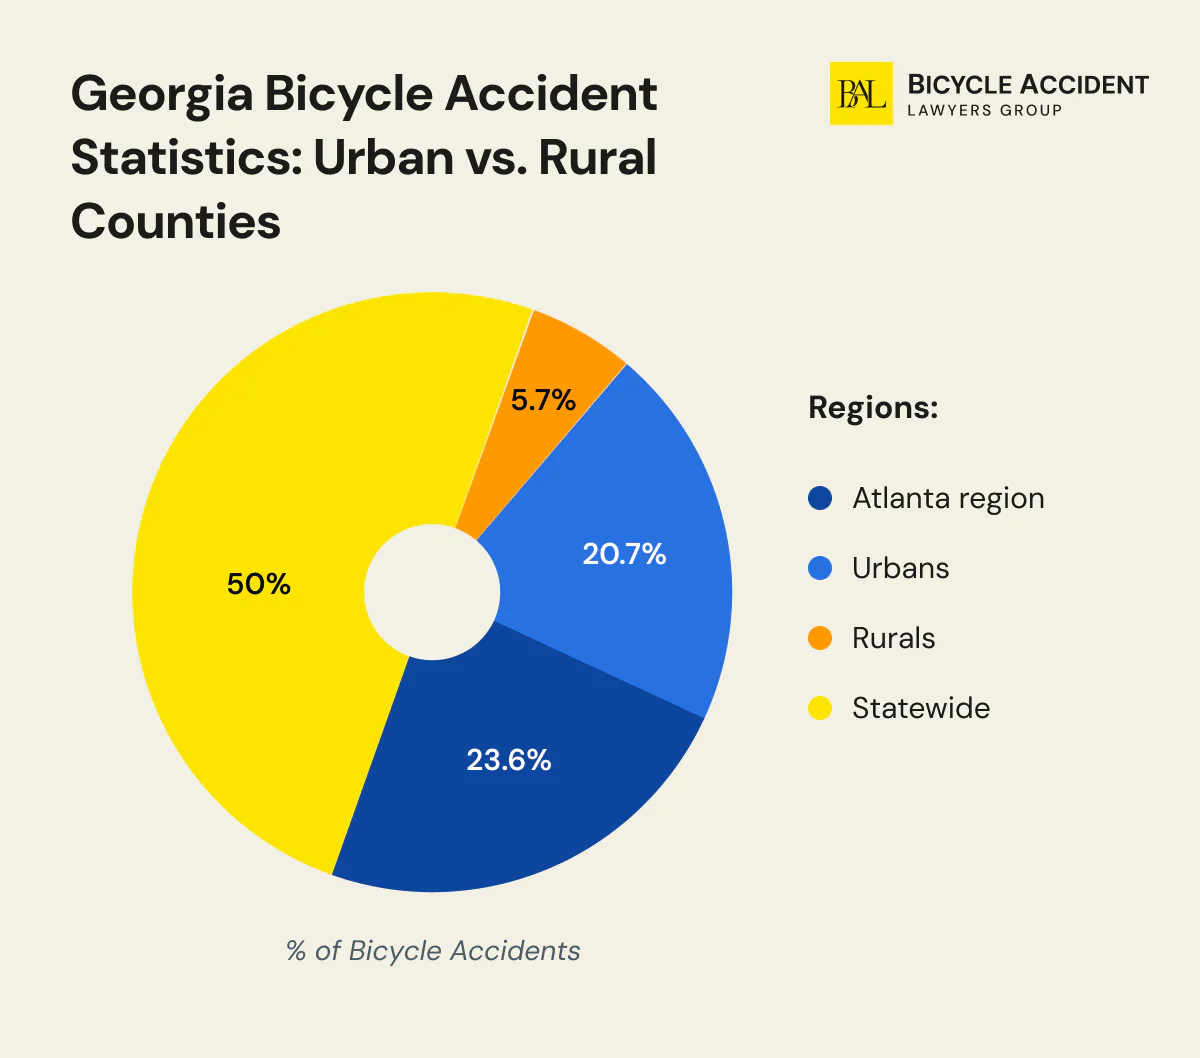
7.60 cyclists per 100K of population got into a bike crash in Georgia in 2022. Urban counties are at the top of the list with a rate of 9.54. Although rural counties have a lower rate at 4.15 per 100K people, the fatality score is considerably higher in these regions. One-third of riders who get involved in a bike accident in rural areas sustain severe and even fatal injuries.
Atlanta is the largest region in Georgia and accounts for 46% of the state’s population. Although almost half of all bike crashes were recorded across Atlanta, the fatality rate in the area is relatively low at 12%. Over 40% of all bicycle accidents occurred in other urban counties of Georgia.
Rural regions of the state show low scores in terms of bicycle accidents, but reflect alarming patterns in terms of cyclist fatalities. This means that although less frequent, bicycle crashes in rural areas are more dangerous. All due to high speed limits, lack of designated infrastructure, and longer emergency response times.
| Region | Bicycle accidents | Severe or fatal injuries |
| Atlanta region (11 counties) | 391 | 48 (12%) |
| Other urban counties (30 counties) | 344 | 75 (22%) |
| Rural counties (118 counties) | 94 | 30 (32%) |
| Statewide | 829 | 153 (18%) |
Note: The urban/rural and injury severity data above is from 2022 (GOHS). The 2023 statewide crash total of 925 referenced elsewhere in this report comes from the Georgia Bikes crash database.
Georgia Bicycle Accident Statistics: Injury Severity Levels
The research indicated that in 2022, the number of injured cyclists who sought medical help after an accident dropped by 4%. However, hospitalization and emergency room visits triggered by bicycle accidents cost the state approximately $75 million, according to the Georgia Governor’s Office of Highway Safety.
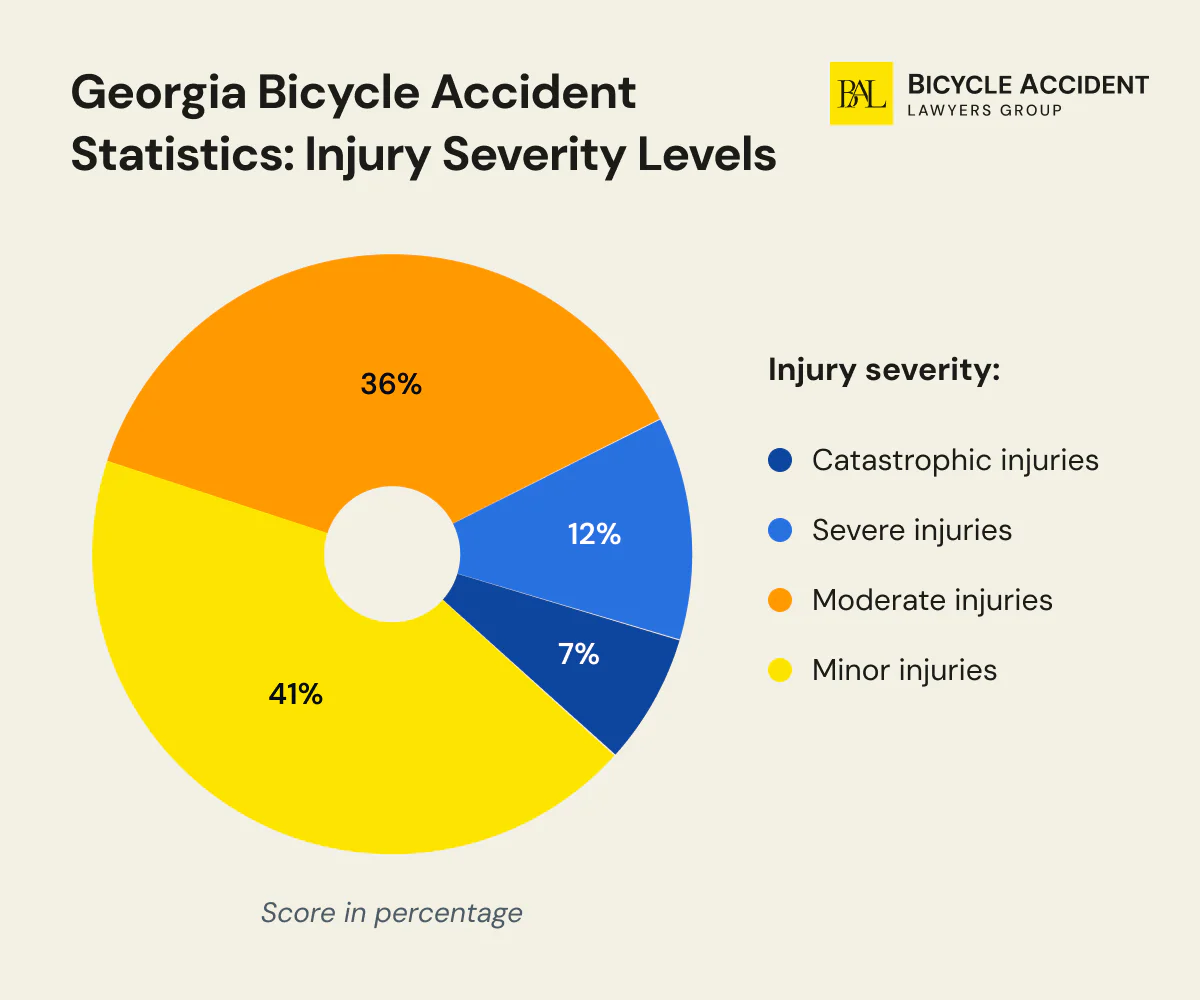
Catastrophic injuries make up only 7% of all the crashes recorded in the area, yet they are the most life-altering. A cyclist hit at high speed by a negligent driver may suffer spinal cord damage or traumatic brain injuries that will have a lasting effect, if not permanent disability.
Severe injuries after bicycle accidents make up a little over 10%, but internal bleeding or compound fractures require lengthy and costly surgeries, rehabilitation, and therapy. On a slightly brighter side, over 40% of injured riders sustain minor traumas like scrapes and bruises that do not require long-term care.
| Injury severity | Score |
| Catastrophic injuries | 7% |
| Severe injuries | 12% |
| Moderate injuries | 36% |
| Minor injuries | 41% |
The presented statistical data proves that catastrophic and severe injuries are less frequent. However, they still underline the importance of infrastructural, medical, and legal support that the state authorities should provide to protect bicycle accident victims.
Georgia Bicycle Accident Statistics: Time-of-Day Trends
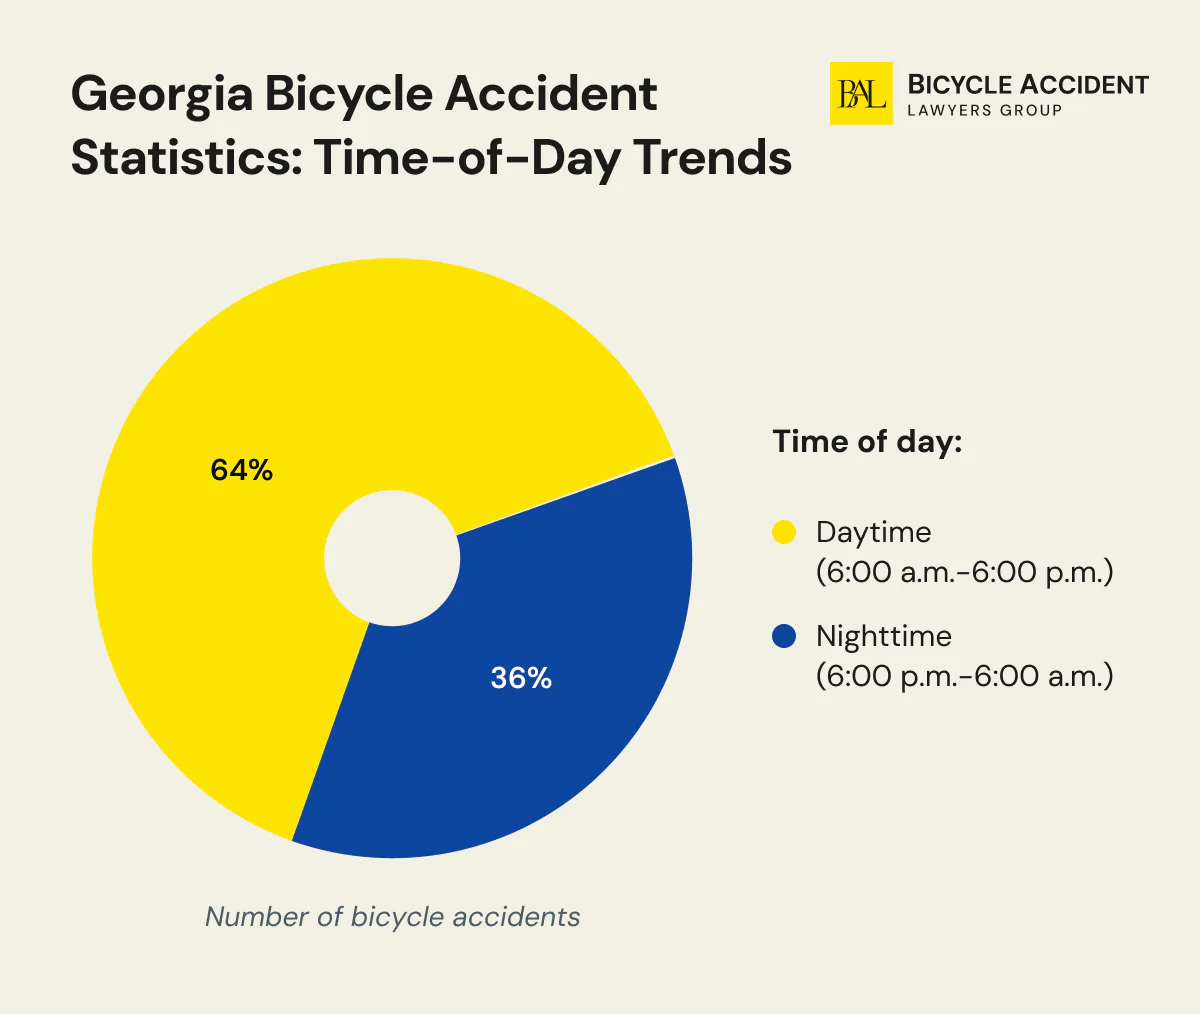
Over 60% of all bicycle accidents in Georgia happen during the day hours. This means that even though visibility is at its peak, traffic volume is also at its peak. At the same time, nighttime crashes, although lower in number, may be more serious as a result of decreased visibility, driver fatigue, or driver impairment.
| Time of day | Number of bicycle accidents | % |
| Daytime (6:00 a.m.-6:00 p.m.) | 528 | 64% |
| Nighttime (6:00 p.m.-6:00 a.m.) | 301 | 36% |
Georgia Bicycle Accident Statistics: Day-of-Week Patterns
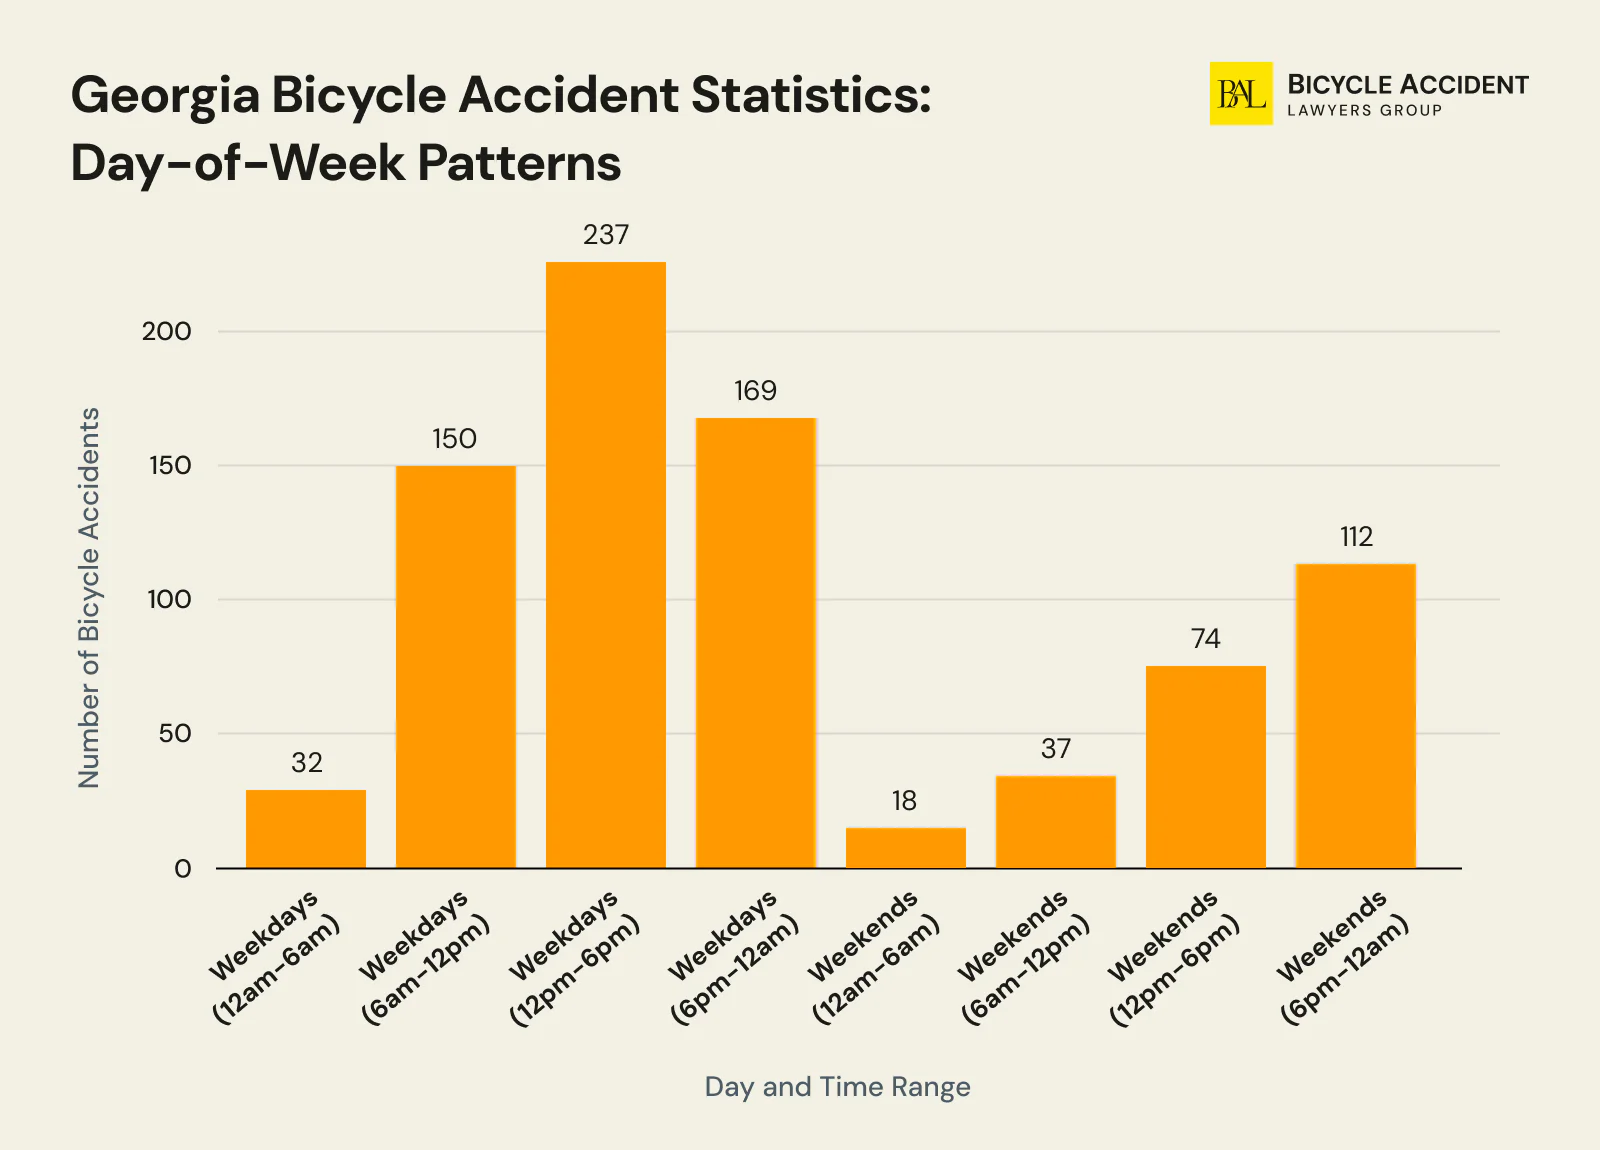
Over 70% of all bike accidents in Georgia happen on weekdays. Many people use bicycles as the primary means of transportation to commute to work or school, hence the concerning trends. The table below reflects that the afternoon hours of an average workday account for over 30% of all bicycle accidents.
Although only 29% of all biking crashes occur on weekends, the nighttime hours are the most dangerous to choose for the activity. Surely, that does not mean that people in Georgia should refuse themselves a recreational ride on a Sunday evening; it means that you should do everything you can to make yourself visible on the road, or stick to designated lanes when planning the route.
| Day of week | Number of bicycle accidents | % |
| Weekdays | 588 | 71% |
| 12:00 a.m. – 5:59 a.m. | 32 | 4% |
| 6:00 a.m. – 11:59 a.m. | 150 | 18% |
| 12:00 p.m. – 5:59 p.m. | 237 | 32% |
| 6:00 p.m. – 11:59 p.m. | 169 | 17% |
| Weekends | 241 | 29% |
| 12:00 a.m. – 5:59 a.m. | 18 | 2% |
| 6:00 a.m. – 11:59 a.m. | 37 | 4% |
| 12:00 p.m. – 5:59 p.m. | 74 | 9% |
| 6:00 p.m. – 11:59 p.m. | 112 | 14% |
Georgia Bicycle Accident Statistics: Seasonal Trends
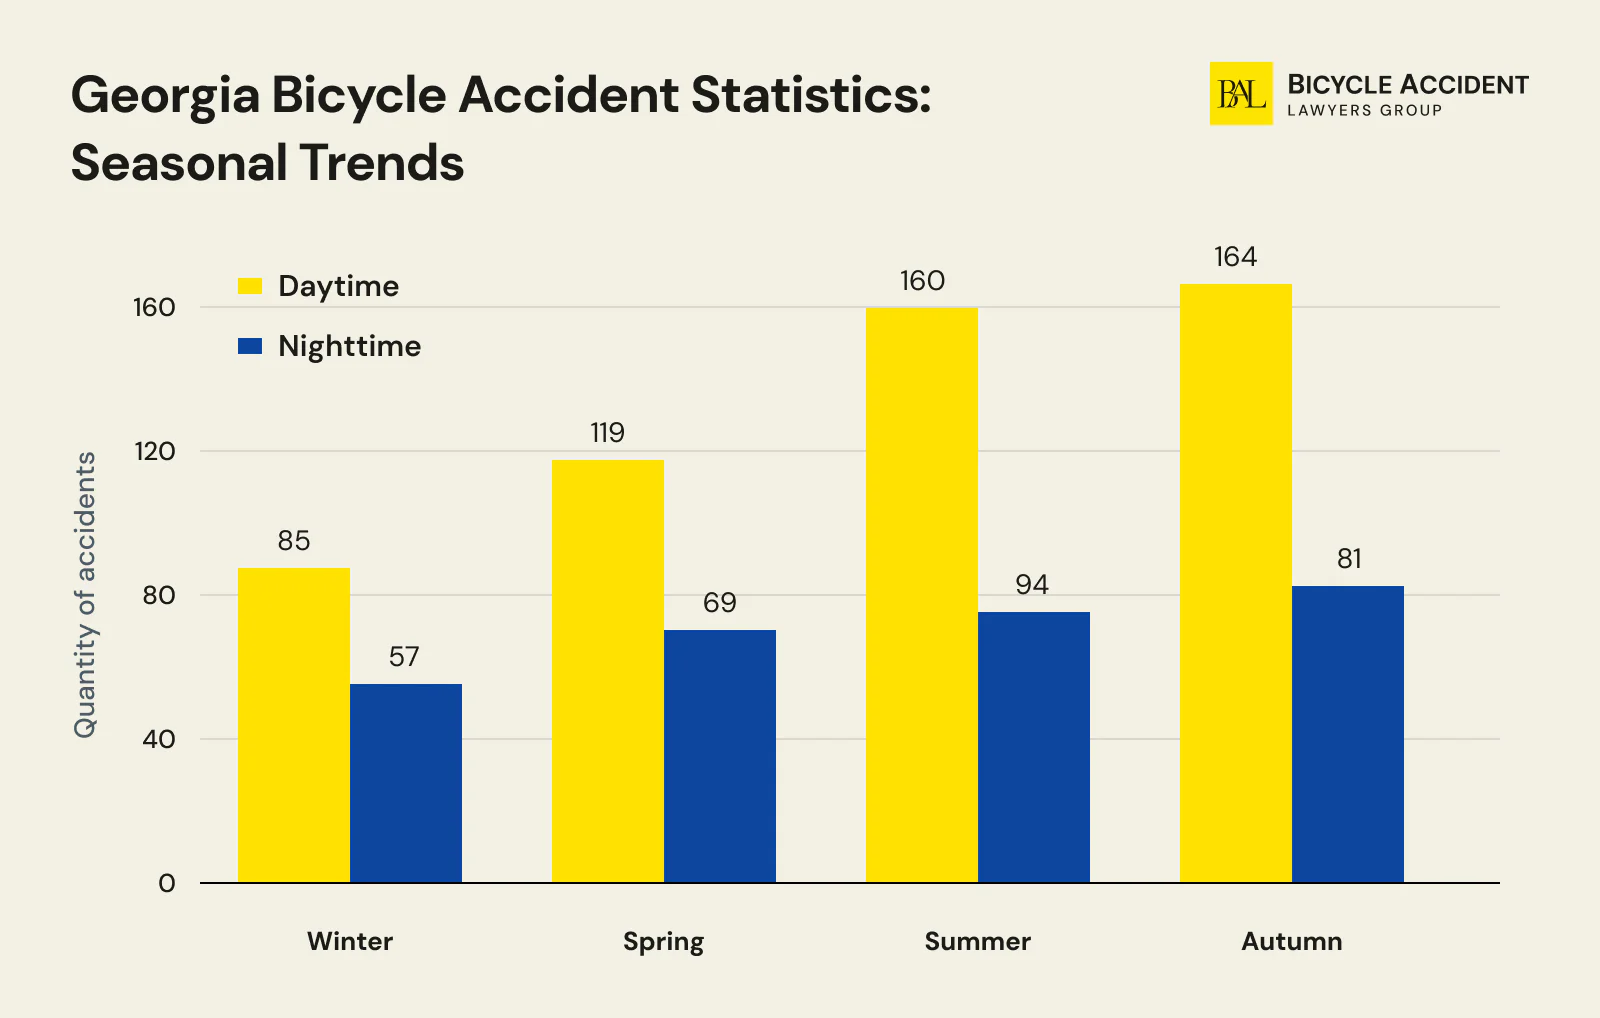
There are a few clear seasonal patterns to discuss when it comes to bicycle accidents in Georgia. Summer and fall are the busiest seasons in terms of biking incidents, together accounting for 61% of all bicycle crashes in the state. Autumn is the single deadliest season at 30% of all crashes. The most logical explanation would be that the warmer months inspire more people to hop on their bikes. Daytime crashes during this time are also prevalent, which signifies the importance of undivided attention when en route.
Although winters are relatively mild in Georgia, temperature drops as well as frequent rains force cyclists to hide away their bikes till spring. Thus, such a low biking incident rate. However, the moment spring takes over, the rate begins to increase.
| Season | Number of bicycle accidents | % |
| Winter | 142 | 17% |
| Daytime | 85 | 10% |
| Nighttime | 57 | 7% |
| Spring | 188 | 23% |
| Daytime | 119 | 14% |
| Nighttime | 69 | 8% |
| Summer | 254 | 31% |
| Daytime | 160 | 19% |
| Nighttime | 94 | 11% |
| Autumn | 265 | 30% |
| Daytime | 164 | 20% |
| Nighttime | 81 | 10% |
Georgia Bicycle Accident Statistics: Helmet Use
According to bike helmet laws in GA, all cyclists under 16 years must wear protective helmets, no matter if they are riding in a dedicated bike lane, shoulder, or highway. Georgia’s three-foot safe passing law (O.C.G.A. 40-6-294) requires drivers to maintain at least three feet of clearance when overtaking a bicycle, but no statewide helmet mandate exists for adult riders. Unlike in other jurisdictions, cyclists in Georgia comply with these traffic rules, but the statistical data shows that there’s room for improvement. Based on an in-depth analysis of bicyclists’ riding habits, we’ve managed to find out the following:
| Condition | Number of GA bicyclists | % |
| Riders injured in bicycle crashes (2022) | 830 | 100% |
| Cyclists using safety equipment | 611 | 73% |
| Bicyclists wearing protective gear | 155 out of 611 | 25% |
| Bike riders’ fatalities in 2020-2022 | 69 | 100% |
| Fatally injured riders with a helmet on | 8 | 11% |
| Fatally injured riders without a helmet | 49 | 64% |
| Fatally injured riders with unknown helmet use | 19 | 25% |
The helmet data is stark: 64% of fatally injured cyclists in Georgia were not wearing a helmet. Only 11% of those killed had a helmet on at the time of the crash. Nationally, the figures are similar, with NHTSA reporting that 62% of pedalcyclists killed were not wearing helmets. This underscores that helmet use remains one of the most actionable safety measures available to individual riders in Georgia.
Hotspots for Bicycle Crashes in Atlanta
The Atlanta region accounted for almost half of all bicycle crashes that took place in Georgia in 2022. Although we can’t advise you to stay on one road and take the other, there are a few accident epicenters to keep in mind while on the ride in the area.
- Edgewood Avenue: The road is situated near Georgia State University, which makes it teem with students, motor vehicles, and bicycles. The area lacks protected lanes but has a large number of busy intersections. These factors combined make it quite dangerous for cyclists.
- Techwood Dr. NW and 5th Street: The intersection is located near the campus of Georgia Tech and features tight road spaces, decreased visibility, and high-speed traffic.
- GA-154/Trinity Ave. SW: This is a busy corridor that lies near various governmental buildings. High congestion, poor lane markings, and double-parking that obstructs visibility often contribute to bicycle accidents that take place in the area.
Georgia vs. National Bicycle Accident Comparison
Georgia’s bicycle safety record reflects several patterns that both align with and deviate from national trends. Understanding where Georgia stands relative to the national average helps contextualize the state’s statistics and identify where the most improvement is needed.
| Metric | Georgia | National |
| Bicycle crashes (2023) | 925 | ~130,000 (est.) |
| Bicyclist fatalities (2023) | 23 | 1,166 (NHTSA) |
| Cyclists as % of all traffic deaths | ~1.4% | 2.9% |
| Decade fatality trend (2014-2023) | +283% | +87% (since 2010) |
| Urban crash share | ~85% | 86% |
| Male fatality share | ~86% | 89% |
| Fatally injured without helmet | 64% | 62% |
| Bicycle Friendly State Ranking | #23 | N/A |
| Hit-and-run share of crashes | ~25% | ~14% (national est.) |
Georgia’s 283% increase in bicycle fatalities over the past decade far outpaces the national 87% increase, suggesting that the state’s road safety improvements have been particularly slow to reach cyclists. The hit-and-run rate at 25% is also notably higher than the national average, pointing to a specific enforcement and accountability gap. On the other hand, Georgia’s lower cyclist share of total traffic fatalities (1.4% vs. 2.9% nationally) reflects that the state’s overall traffic fatality burden is driven more heavily by motor vehicle occupant deaths.
Final Thoughts on Bicycle Accident Statistics in Georgia
Georgian authorities seem to have taken a few steps to make cycling safer statewide. However, the recent accident trends prove that there’s a lot of room for improvement concerning local infrastructure, social awareness, and traffic safety ordinances.
The data outlines gaps and patterns that the municipalities should attend to. Meanwhile, if you are an avid cyclist in Georgia or plan a biking trip through the state, you must keep yourself informed on when, where, and why the most bicycle crashes take place. Moreover, you should always be legally armed after any type of bicycle accidents to protect your rights and secure fair compensation should anything happen.
Contact Bicycle Accident Lawyers Group for a free consultation to learn more!
Data Sources
The statistics in this report are drawn from the following sources:
- Georgia Bikes Crash Data Dashboard – Primary source for 2023 statewide crash counts, county-level data, and crash location breakdowns. Data is derived from the Georgia Electronic Accident Reporting System (GEARS).
- Georgia Governor’s Office of Highway Safety (GOHS) – Source for 2022 non-motorist fact sheet data, including urban/rural breakdowns, injury severity levels, hospitalization costs, and helmet use statistics.
- NHTSA Fatality Analysis Reporting System (FARS) – Federal source for traffic fatality data used in national comparisons.
- League of American Bicyclists – Source for the 2024 Bicycle Friendly State rankings.
Some sections use 2022 data (urban/rural, injury severity, helmet use) from the GOHS fact sheet, while others use 2023 data from the Georgia Bikes crash database. Where the data year differs, it is noted in the relevant section.
Share the details of your situation with us so we can begin advocating on your behalf. We customize our approach to fit the unique needs of each client.


Robert Goldwater is a cyclist representing cyclists. He has practiced personal injury and wrongful death law for more than 20 years, graduating with Honors from Arizona State University Law School, and has helped recover over $1 billion for clients, including injured cyclists.


