

Georgia recorded 965 bicycle crashes and 22 bicyclist deaths in 2024, according to the the Governor’s Office of Highway Safety released this year. That crash count is the highest in the 5 years the state publishes, and the death toll is the second lowest.
Those 2 numbers move in opposite directions, with more riders being hit and fewer dying, and the risk has shifted from the statewide average toward specific places. The sharpest shift is rural, where 32% of bicycle crashes now end in a death or a serious injury.
- Key Georgia Bicycle Accident Statistics
- A Decade of Bicycle Accidents in Georgia: The Story of Numbers
- Deaths per 1,000 reported bicycle crashes
- Bicycle Accidents in Georgia: County-by-County
- Bicycle Accidents in Georgia: Does Gender Affect the Rates?
- Bicycle Accidents in Georgia: Age Risk
- Statistics of Bicycle Accidents in Georgia: Common Causes
- Vehicle type and crash severity
- Bicycle Accidents in Georgia: Dangerous Light Conditions
- Georgia Bicycle Accident Statistics: Types of Road
- Georgia Bicycle Accident Statistics: Urban vs. Rural Counties
- Severe-outcome share against crash share
- Bicycle crash rate by region
- Georgia Bicycle Accident Statistics: Injury Severity Levels
- Georgia Bicycle Accident Statistics: Time-of-Day Trends
- Georgia Bicycle Accident Statistics: Day-of-Week Patterns
- Georgia Bicycle Accident Statistics: Seasonal Trends
- Georgia Bicycle Accident Statistics: Helmet Use
- Hotspots for Bicycle Crashes in Atlanta
- Georgia vs. National Bicycle Accident Comparison
- Final Thoughts on Bicycle Accident Statistics in Georgia
- Data Sources
- Get a FREE case evaluation today
Key Georgia Bicycle Accident Statistics
- Georgia recorded 965 bicycle crashes in 2024, the highest count in 5 years, while bicyclist deaths fell to 22.
- 32% of rural bicycle crashes end in a death or a serious injury, against 12% inside metro Atlanta.
- A reported bicycle crash was 53% less likely to kill the rider in 2024 than in 2020.
- 18% of Georgia bicycle crashes are hit-and-runs, which puts your own uninsured motorist coverage in play.
- Impaired riders appear in 19% of severe bicycle crashes, and Georgia bars your recovery entirely at 50% fault.
- Georgia law does not let an insurer treat your lack of a helmet as evidence of negligence.
A Decade of Bicycle Accidents in Georgia: The Story of Numbers
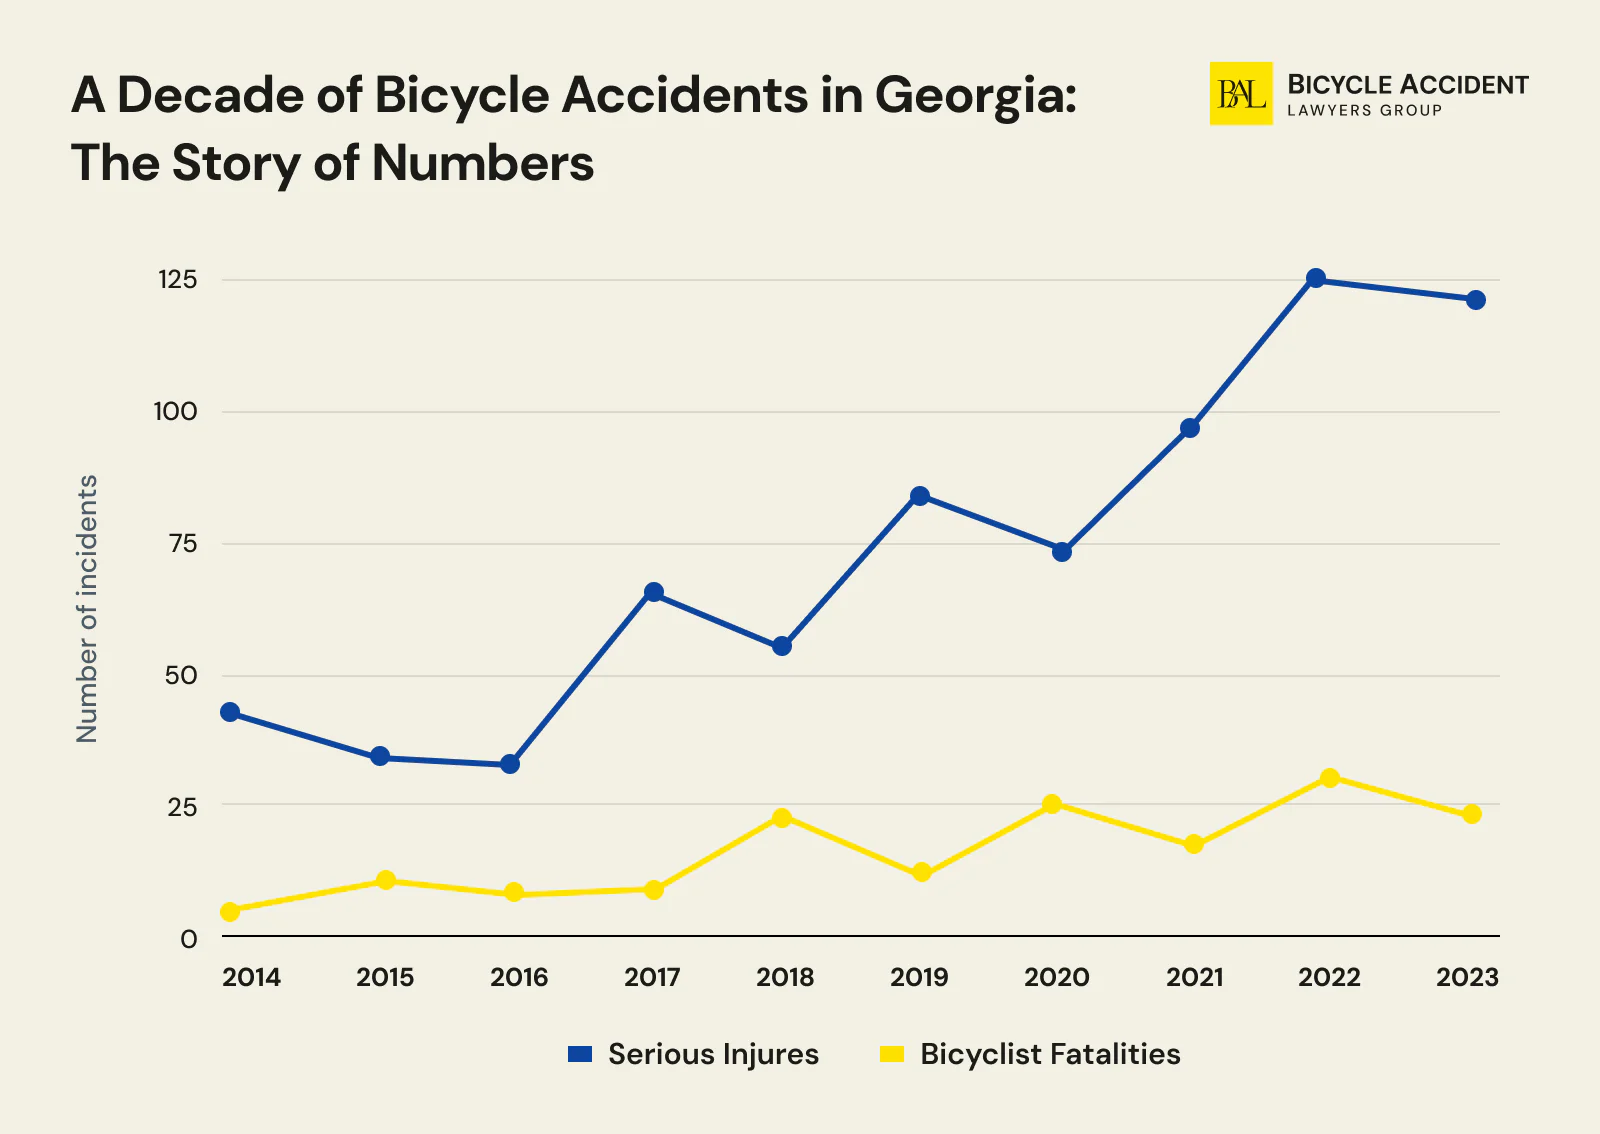
Georgia bicyclist deaths have been flat for 10 years. The state recorded 23 in 2015 and 22 in 2024, and in between the count swung from a high of 32 down to 15 and back again without settling into a trend in either direction.
| Year | Bicyclist deaths | All Georgia traffic deaths | Cyclist share |
| 2015 | 23 | 1,432 | 1.6% |
| 2016 | 29 | 1,556 | 1.9% |
| 2017 | 15 | 1,540 | 1.0% |
| 2018 | 30 | 1,505 | 2.0% |
| 2019 | 21 | 1,492 | 1.4% |
| 2020 | 32 | 1,658 | 1.9% |
| 2021 | 15 | 1,809 | 0.8% |
| 2022 | 29 | 1,796 | 1.6% |
| 2023 | 24 | 1,610 | 1.5% |
| 2024 | 22 | 1,403 | 1.6% |
240 people died riding bicycles in Georgia over those 10 years. The cyclist share of all traffic deaths has never moved outside a band of 0.8% to 2.0%, which tracks the state’s overall road toll instead of diverging from it.
The crash count moved.
| Year | Bicycle crashes | Serious injury or fatal crashes | Share |
| 2020 | 654 | 100 | 15% |
| 2021 | 731 | 109 | 15% |
| 2022 | 829 | 153 | 18% |
| 2023 | 921 | 140 | 15% |
| 2024 | 965 | 155 | 16% |
Crashes rose 48% between 2020 and 2024 while deaths fell. More Georgians are being struck while riding, and a smaller fraction of those collisions is proving fatal.
Deaths per 1,000 reported bicycle crashes
| Year | Deaths | Crashes | Deaths per 1,000 crashes |
| 2020 | 32 | 654 | 48.9 |
| 2021 | 15 | 731 | 20.5 |
| 2022 | 29 | 829 | 35.0 |
| 2023 | 24 | 921 | 26.1 |
| 2024 | 22 | 965 | 22.8 |
A reported Georgia bicycle crash was 53% less likely to kill the cyclist in 2024 than in 2020, falling from 48.9 deaths per 1,000 crashes to 22.8. Measured from 2022 the rate fell by a third.
Bicycle Accidents in Georgia: County-by-County
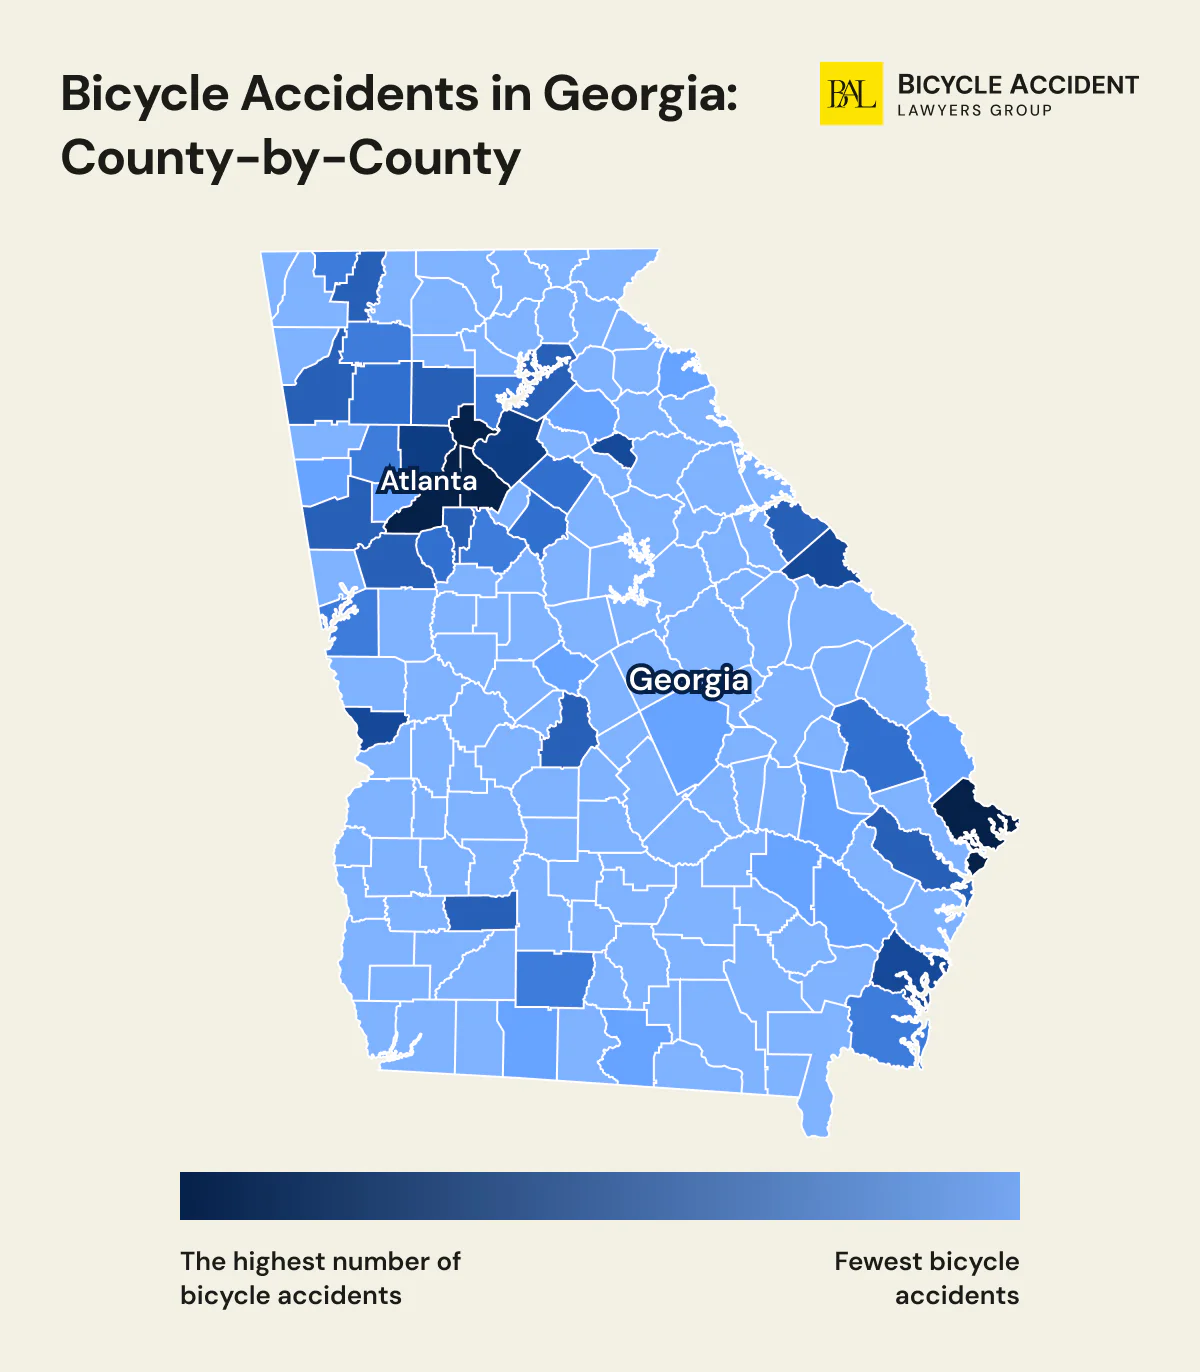
According to the recent survey, Fulton County is the most dangerous region, with 154 bicycle accidents occurring there in 2023. At the same time, Chatham and Richmond counties seem to be the deadliest, 8 people lost their lives there (4 fatalities each). Overall, it is safe to assume that metro areas pose a palpable threat to riders. However, in smaller counties like McIntosh and Pulaski, the death rate matches the crash rate, reflecting a 100% fatality score.
| County | Total bike crashes | Total bicyclist fatalities | Serious injuries |
| Appling | 3 | 0 | 1 |
| Atkinson | 2 | 0 | 0 |
| Bacon | 2 | 0 | 1 |
| Baldwin | 1 | 0 | 0 |
| Banks | 1 | 0 | 1 |
| Bartow | 11 | 0 | 1 |
| Ben Hill | 1 | 0 | 0 |
| Berrien | 1 | 0 | 0 |
| Bibb | 4 | 1 | 0 |
| Bleckley | 1 | 0 | 3 |
| Brantley | 1 | 0 | 0 |
| Bryan | 2 | 0 | 0 |
| Bulloch | 11 | 1 | 1 |
| Butts | 1 | 0 | 0 |
| Camden | 6 | 1 | 1 |
| Candler | 2 | 0 | 1 |
| Carroll | 14 | 0 | 3 |
| Catoosa | 5 | 0 | 0 |
| Charlton | 1 | 0 | 0 |
| Chatham | 98 | 4 | 13 |
| Cherokee | 15 | 0 | 2 |
| Clarke | 28 | 0 | 5 |
| Clayton | 18 | 0 | 5 |
| Cobb | 67 | 0 | 4 |
| Colquitt | 5 | 0 | 2 |
| Columbia | 9 | 0 | 1 |
| Cook | 1 | 0 | 1 |
| Coweta | 14 | 0 | 3 |
| Decatur | 2 | 0 | 0 |
| DeKalb | 85 | 2 | 5 |
| Dooly | 1 | 0 | 1 |
| Dougherty | 15 | 0 | 0 |
| Douglas | 4 | 0 | 1 |
| Effingham | 3 | 0 | 0 |
| Elbert | 2 | 0 | 1 |
| Evans | 1 | 0 | 0 |
| Fayette | 9 | 0 | 1 |
| Floyd | 14 | 1 | 5 |
| Forsyth | 6 | 0 | 1 |
| Fulton | 154 | 1 | 19 |
| Gilmer | 1 | 0 | 0 |
| Glynn | 21 | 0 | 2 |
| Gordon | 6 | 0 | 0 |
| Grady | 1 | 0 | 0 |
| Gwinnett | 56 | 3 | 7 |
| Habersham | 1 | 0 | 0 |
| Hall | 16 | 0 | 1 |
| Haralson | 3 | 0 | 0 |
| Hart | 3 | 0 | 0 |
| Henry | 6 | 0 | 1 |
| Houston | 14 | 1 | 1 |
| Jackson | 3 | 0 | 0 |
| Lamar | 2 | 0 | 0 |
| Laurens | 4 | 0 | 1 |
| Liberty | 10 | 0 | 0 |
| Lowndes | 3 | 0 | 0 |
| Lumpkin | 2 | 0 | 1 |
| Macon | 1 | 0 | 0 |
| MacDuffie | 1 | 1 | 0 |
| McIntosh | 1 | 1 | 0 |
| Mitchell | 1 | 0 | 1 |
| Monroe | 2 | 0 | 0 |
| Morgan | 1 | 0 | 0 |
| Murray | 1 | 0 | 0 |
| Muscogee | 24 | 0 | 3 |
| Newton | 7 | 1 | 2 |
| Oconee | 1 | 0 | 0 |
| Paulding | 7 | 0 | 1 |
| Peach | 1 | 0 | 0 |
| Polk | 2 | 0 | 0 |
| Pulaski | 1 | 1 | 0 |
| Richmond | 34 | 4 | 6 |
| Spalding | 1 | 0 | 1 |
| Stephens | 2 | 0 | 1 |
| Sumter | 1 | 0 | 0 |
| Tattnall | 3 | 0 | 1 |
| Thomas | 4 | 0 | 1 |
| Tift | 2 | 0 | 0 |
| Toombs | 2 | 0 | 0 |
| Troup | 7 | 0 | 1 |
| Union | 1 | 0 | 0 |
| Upson | 2 | 0 | 0 |
| Walker | 2 | 0 | 1 |
| Walton | 7 | 0 | 3 |
| Ware | 2 | 0 | 0 |
| Wayne | 3 | 0 | 0 |
| White | 2 | 0 | 0 |
| Whitfield | 10 | 0 | 1 |
Bicycle Accidents in Georgia: Does Gender Affect the Rates?
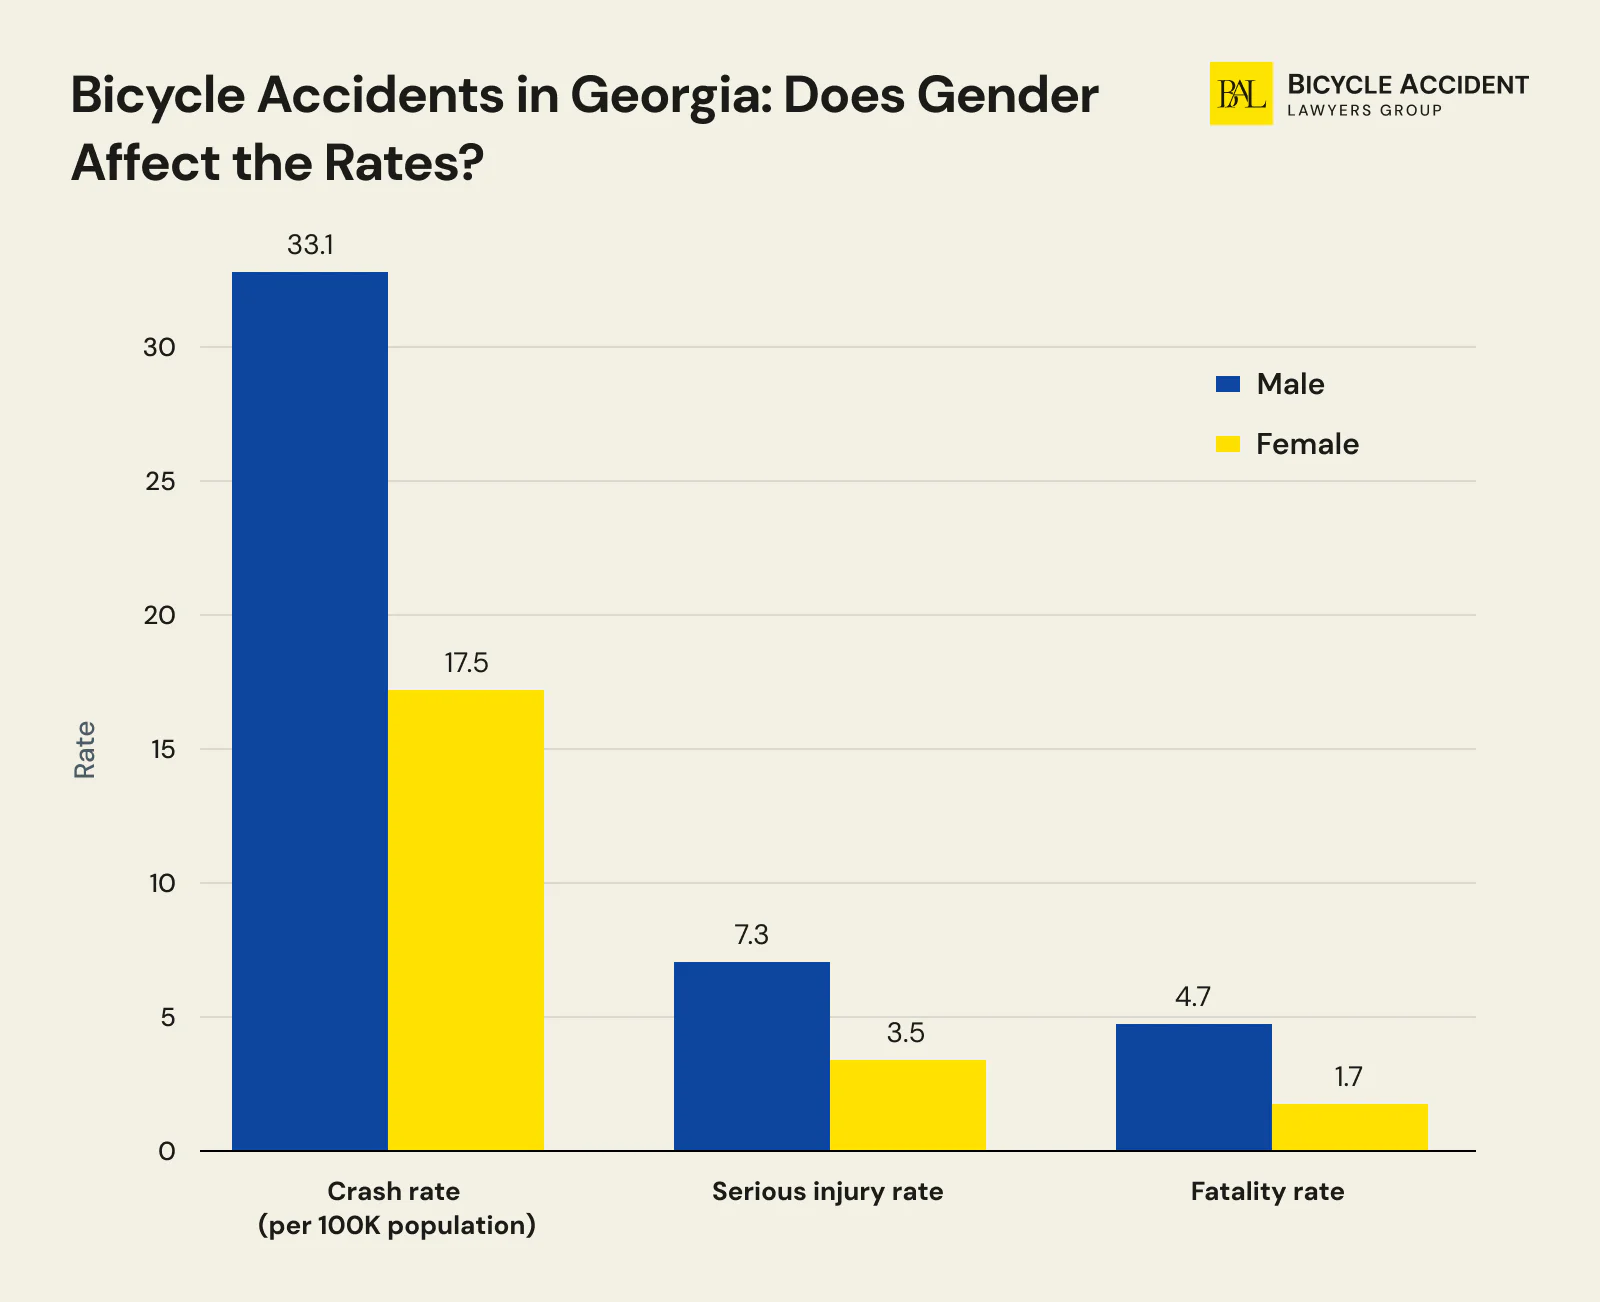
The recent data proves that the gender of bicyclists in Georgia has a palpable impact on overall accident statistics in the state and reflects several noticeable patterns. On average, bicycle accidents occur to male riders 1.9 times more often than to female bikers. Moreover, males are 2.8 times more likely to sustain fatal injuries in a bike crash. This aligns with the national pattern, where males account for approximately 89% of all bicycle deaths across the United States.
| Metric | Male bicyclists | Female cyclists |
| Crash rate per 100K population | 33.1 | 17.5 |
| Serious injury rate | 7.3 | 3.5 |
| Fatality rate | 4.7 | 1.7 |
These numbers point out a few critical issues to be handled on both the governmental and social levels. First of all, male cyclists may be prone to more risk-taking behavior, such as higher speeds, ignoring wearing helmets when riding, and choosing locations without designated bike lanes or other faulty infrastructure. This means that local authorities may want to consider spreading awareness about the topic, investing in gender-specific safety campaigns, improving biking infrastructure planning, and updating or strengthening existing Georgia bike laws.
Bicycle Accidents in Georgia: Age Risk
Riders aged 55 to 64 absorbed more of Georgia’s serious bicycle injuries and deaths than any other age group in 2024, at 27 of 150. Measured against population, the highest-risk group is younger, and it is riders aged 21 to 24.
| Age group | Serious injuries and deaths | Share | Rate per 100,000 in that age group |
| Under 10 | 5 | 3% | 0.38 |
| 10 to 14 | 9 | 6% | 1.23 |
| 15 to 20 | 8 | 5% | 0.85 |
| 21 to 24 | 15 | 10% | 2.51 |
| 25 to 34 | 25 | 17% | 1.62 |
| 35 to 44 | 24 | 16% | 1.59 |
| 45 to 54 | 24 | 16% | 1.70 |
| 55 to 64 | 27 | 18% | 1.99 |
| 65 and over | 11 | 7% | 0.62 |
| All ages | 150 | 100% | 1.34 |
The count column and the rate column tell different stories, and both are true. The 55 to 64 group has the most people in it who were badly hurt. The 21 to 24 group has the highest chance of being one of them, at 2.51 per 100,000, roughly double the statewide rate of 1.34.
Riders over 65 record the second-lowest rate on the table at 0.62.
In 2024 the average age of an American bicyclist killed in traffic was 48, and the largest numbers of deaths fell in the 60 to 64 and 55 to 59 groups. Older riders are underrepresented in Georgia’s serious injury counts and overrepresented in the national death counts. A crash that a rider in their twenties survives is a crash a rider in their sixties often does not.
Children are largely absent from both datasets. Riders under 15 accounted for 9% of Georgia’s serious bicycle injuries and deaths in 2024, and children 14 and under were 5% of American bicyclist deaths.
Statistics of Bicycle Accidents in Georgia: Common Causes
Georgia measures which behaviors concentrate in severe crashes involving a non-motorist.
| Factor | Share of all non-motorist crashes | Share of severe crashes |
| Impaired bicyclist | 5% | 19% |
| Distracted driving | 18% | 18% |
| Hit-and-run | 21% | 17% |
| Impaired driving | 4% | 11% |
| Impaired pedestrian | 4% | 10% |
| Speeding | 2% | 4% |
| Distracted bicyclist (confirmed) | 1% | 1% |
A rider who had been drinking appears in 19% of severe bicycle-related crashes, against 5% of crashes overall. That is the sharpest concentration of any factor in the table, and nearly double the figure for impaired drivers. Distracted riding shows up in 1% and does not concentrate in severe crashes.
Distracted driving behaves differently again. It appears in 18% of all crashes and 18% of severe ones, which means it causes a great many collisions without making any individual collision worse. Hit-and-run is the reverse. It is more common in property-damage crashes, at 29%, than in severe ones, at 17%.
Vehicle type and crash severity
Large trucks appear in 2% of all crashes involving a non-motorist and 5% of the severe ones. Passenger vehicles run the other way, at 51% of all crashes and 47% of severe ones.
| Vehicle type | Share of all non-motorist crashes | Share of severe crashes |
| Passenger vehicle | 51% | 47% |
| Large truck | 2% | 5% |
| Motorcycle | 1% | 2% |
A large truck is 2.5 times as likely to turn up in a severe non-motorist crash as its share of all such crashes would predict.
The driver who hit you may have no recorded age
Drivers aged 25 to 34 account for 19% of drivers in non-motorist crashes and 20% of those in severe ones. Drivers 65 and over account for 12% of all and 9% of severe, which is the only age band that appears less often in the serious crashes than in the routine ones.
The largest single category is neither, because 15% of drivers involved in a non-motorist crash have no age recorded at all, the driver having left before anyone took it down. In severe crashes that figure is 11%.
Bicycle Accidents in Georgia: Dangerous Light Conditions
73% of Georgia bicycle crashes happened in daylight in 2024, against 26% in the dark.
| Light condition | Bicycle crashes | Share |
| Daylight | 708 | 73% |
| Dark | 255 | 26% |
| Dusk | 22 | 2% |
| Dawn | 10 | 1% |
The federal fatality census counts deaths by light condition, and nationally in 2024 52% of bicyclist deaths occurred in the dark against 44% in daylight.
So most collisions happen in daylight and most fatal ones happen after dark. Night riding carries a lower chance of a collision and a much higher chance that the collision kills you.
A driver who cannot see a rider until the last second brakes late or not at all, so impact speeds run higher in the dark. Night traffic also carries a higher share of impaired drivers than daytime traffic does.
Georgia Bicycle Accident Statistics: Types of Road
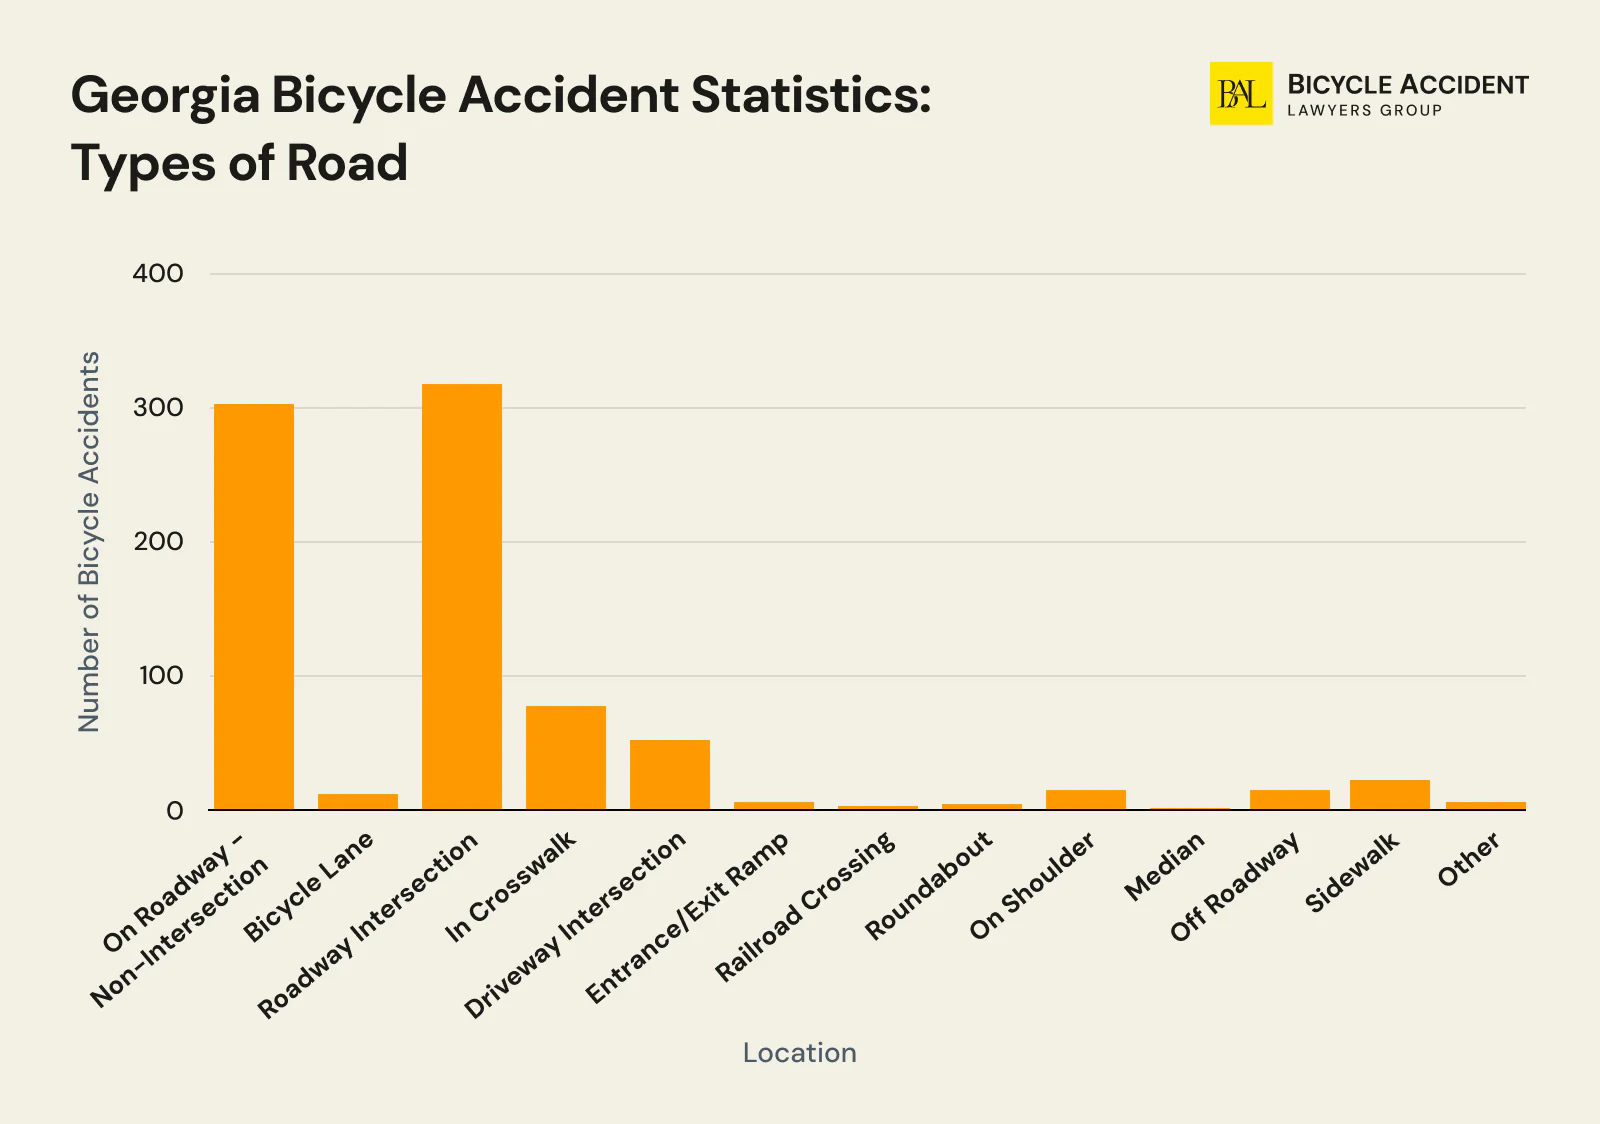
Over 55% of all bicycle accidents take place at or near intersections in Georgia, making intersection crashes the most common location type. However, the absence of intersections in the vicinity does not rule out the chance of an incident. On the contrary, 38% of bike crashes happen on straight, non-intersection parts of the road across the state. Interestingly, less than 5% of all bicycle accidents occurred in areas designed for vulnerable road user categories, such as a bike lane, shoulder, or sidewalk.
Hit-and-run accidents account for approximately 25% of all bicycle crashes in Georgia, and many of these incidents are not fully reflected in the location data below.
| Location | Number of bicycle accidents | % |
| Not at an intersection | 314 | 38% |
| On roadway, non-Intersection | 301 | 36% |
| Bicycle lane | 13 | 2% |
| At intersection | 458 | 55% |
| Roadway intersection | 318 | 38% |
| In crosswalk | 76 | 9% |
| Driveway intersection | 55 | 7% |
| Entrance/exit ramp | 4 | <1% |
| Railroad crossing | 2 | <1% |
| Roundabout | 3 | <1% |
| Roadside | 16 | 2% |
| On shoulder | 15 | 2% |
| Median | 1 | <1% |
| Off-roadway | 37 | 4% |
| Off roadway | 16 | 2% |
| Sidewalk | 21 | 3% |
| Other | 4 | <1% |
Georgia Bicycle Accident Statistics: Urban vs. Rural Counties
32% of rural bicycle crashes ended in a death or a serious injury in 2024, against 12% in the 11 counties of the Atlanta Region. A rural bicycle crash in Georgia is 2.7 times as likely to kill or seriously hurt the person riding.
The rural severity share was 24% in 2023 and 32% in 2024, while the Atlanta figure held at 12% and the other urban counties held at 17%.
| Region | Bicycle crashes | Fatal or serious injury crashes | Share |
| Atlanta Region (11 counties) | 475 | 57 | 12% |
| Other urban counties (30) | 397 | 68 | 17% |
| Rural counties (118) | 93 | 30 | 32% |
| Statewide | 965 | 155 | 16% |
Severe-outcome share against crash share
Rural Georgia produced 9.6% of the state’s bicycle crashes and 19.4% of its serious ones. Setting each region’s share of severe outcomes against its share of crashes gives an index of how far that region’s outcomes run ahead of its volume.
| Region | Share of crashes | Share of severe outcomes | Index |
| Atlanta Region | 49.2% | 36.8% | 0.75 |
| Other urban counties | 41.1% | 43.9% | 1.07 |
| Rural counties | 9.6% | 19.4% | 2.01 |
Rural counties carry exactly twice the share of Georgia’s severe bicycle outcomes that their crash volume would predict. Metro Atlanta carries three quarters of what its volume would predict.
Bicycle crash rate by region
Crash volume and crash rate point at different places. The Atlanta Region holds 46% of Georgia’s population and produced 49% of its bicycle crashes. The 30 other urban counties outside metro Atlanta carry the highest rate in the state, for the second year running.
| Region | Bicycle crashes per 100,000 residents |
| Other urban counties | 10.70 |
| Atlanta Region | 9.21 |
| Statewide | 8.63 |
| Rural counties | 4.02 |
Georgia Bicycle Accident Statistics: Injury Severity Levels
Georgia trauma centers treated 259 bicyclists hurt in traffic crashes in 2024, and 11% of them arrived with injuries scored very severe. Most riders who reach a trauma center are not catastrophically hurt, and the minority who are account for nearly all of the long-term cost.
| Injury severity at the trauma center | Share of bicyclists |
| Minor | 44% |
| Moderate | 30% |
| Severe | 16% |
| Very severe | 11% |
The presented statistical data proves that catastrophic and severe injuries are less frequent. However, they still underline the importance of infrastructural, medical, and legal support that the state authorities should provide to protect bicycle accident victims.
Bicyclists arrive in better shape than pedestrians do. Among pedestrians treated at the same trauma centers, 19% were scored very severe against the cyclists’ 11%, which reflects the difference between being struck while standing and being struck while already moving with the traffic.
5 surveillance systems count injured bicyclists.
| How the injury was counted | 2022 | 2023 | 2024 | Change |
| Serious injury on the police report | 120 | 117 | 128 | up 9% |
| Emergency medical services transports | 554 | 309 | 788 | up 155% |
| Trauma center patients | 196 | 275 | 259 | down 6% |
| Emergency department visits | 351 | 404 | 376 | down 7% |
| Hospital admissions | 79 | 101 | 104 | up 3% |
Police-reported serious injuries rose 9% to 128. That row is drawn from the same crash reports as the crash counts elsewhere on this page.
Georgia counts an injury as serious when it prevents the injured person from walking, driving, or carrying on the activities they were capable of before the crash. An officer applies that test at the scene. It is not a medical finding and it does not bind your claim.
Georgia Bicycle Accident Statistics: Time-of-Day Trends
Two-thirds of Georgia bicycle crashes, 645 of 965, happened during daytime hours in 2024, with the state splitting the clock at 6:00 a.m. and 6:00 p.m.
| Time of day | Bicycle crashes | Share |
| Daytime, 6:00 a.m. to 5:59 p.m. | 645 | 67% |
| Nighttime, 6:00 p.m. to 5:59 a.m. | 320 | 33% |
The daytime share moved from 65% in 2023 to 67% in 2024.
Darkness accounts for 26% of Georgia’s bicycle crashes and 52% of the nation’s bicyclist deaths.
Nationally, 26% of autumn bicyclist deaths in 2024 fell between 6:00 p.m. and 8:59 p.m., the largest share of any 3-hour window in that season.
Georgia Bicycle Accident Statistics: Day-of-Week Patterns
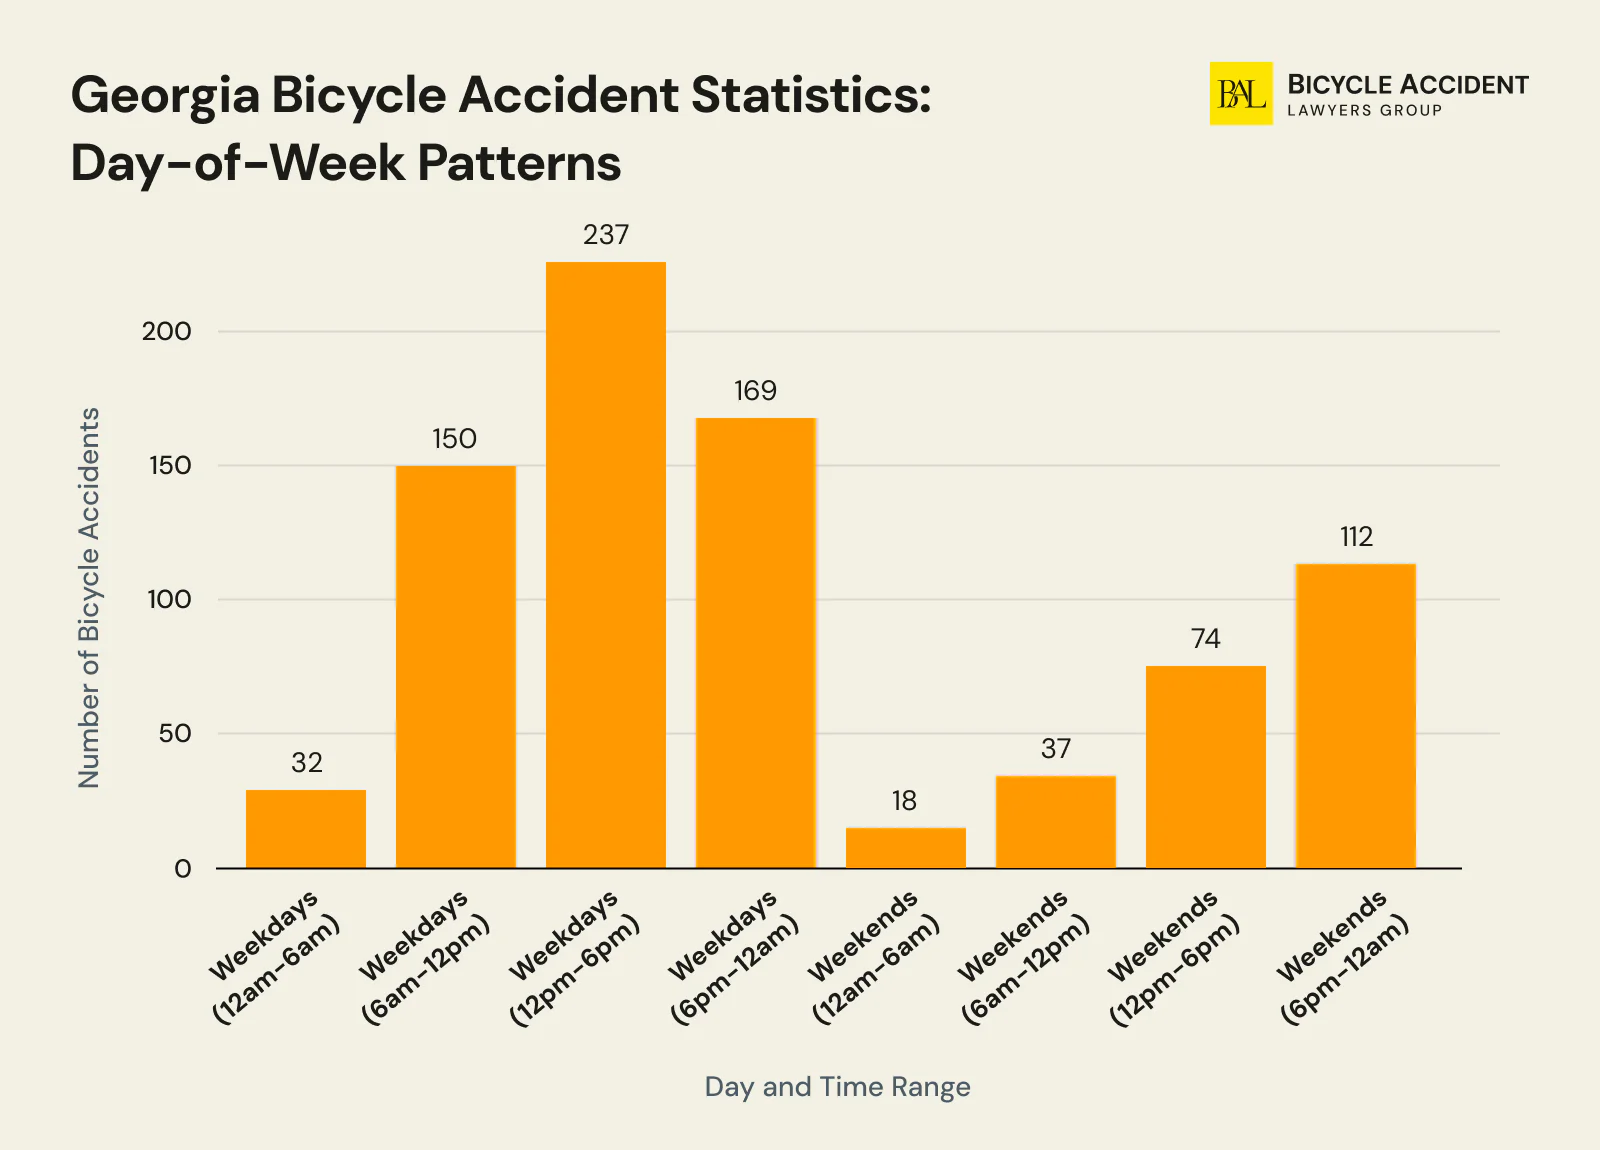
Over 70% of all bike accidents in Georgia happen on weekdays. Many people use bicycles as the primary means of transportation to commute to work or school, hence the concerning trends. The table below reflects that the afternoon hours of an average workday account for over 30% of all bicycle accidents.
Although only 29% of all biking crashes occur on weekends, the nighttime hours are the most dangerous to choose for the activity. Surely, that does not mean that people in Georgia should refuse themselves a recreational ride on a Sunday evening; it means that you should do everything you can to make yourself visible on the road, or stick to designated lanes when planning the route.
| Day of week | Number of bicycle accidents | % |
| Weekdays | 588 | 71% |
| 12:00 a.m. – 5:59 a.m. | 32 | 4% |
| 6:00 a.m. – 11:59 a.m. | 150 | 18% |
| 12:00 p.m. – 5:59 p.m. | 237 | 32% |
| 6:00 p.m. – 11:59 p.m. | 169 | 17% |
| Weekends | 241 | 29% |
| 12:00 a.m. – 5:59 a.m. | 18 | 2% |
| 6:00 a.m. – 11:59 a.m. | 37 | 4% |
| 12:00 p.m. – 5:59 p.m. | 74 | 9% |
| 6:00 p.m. – 11:59 p.m. | 112 | 14% |
Georgia Bicycle Accident Statistics: Seasonal Trends
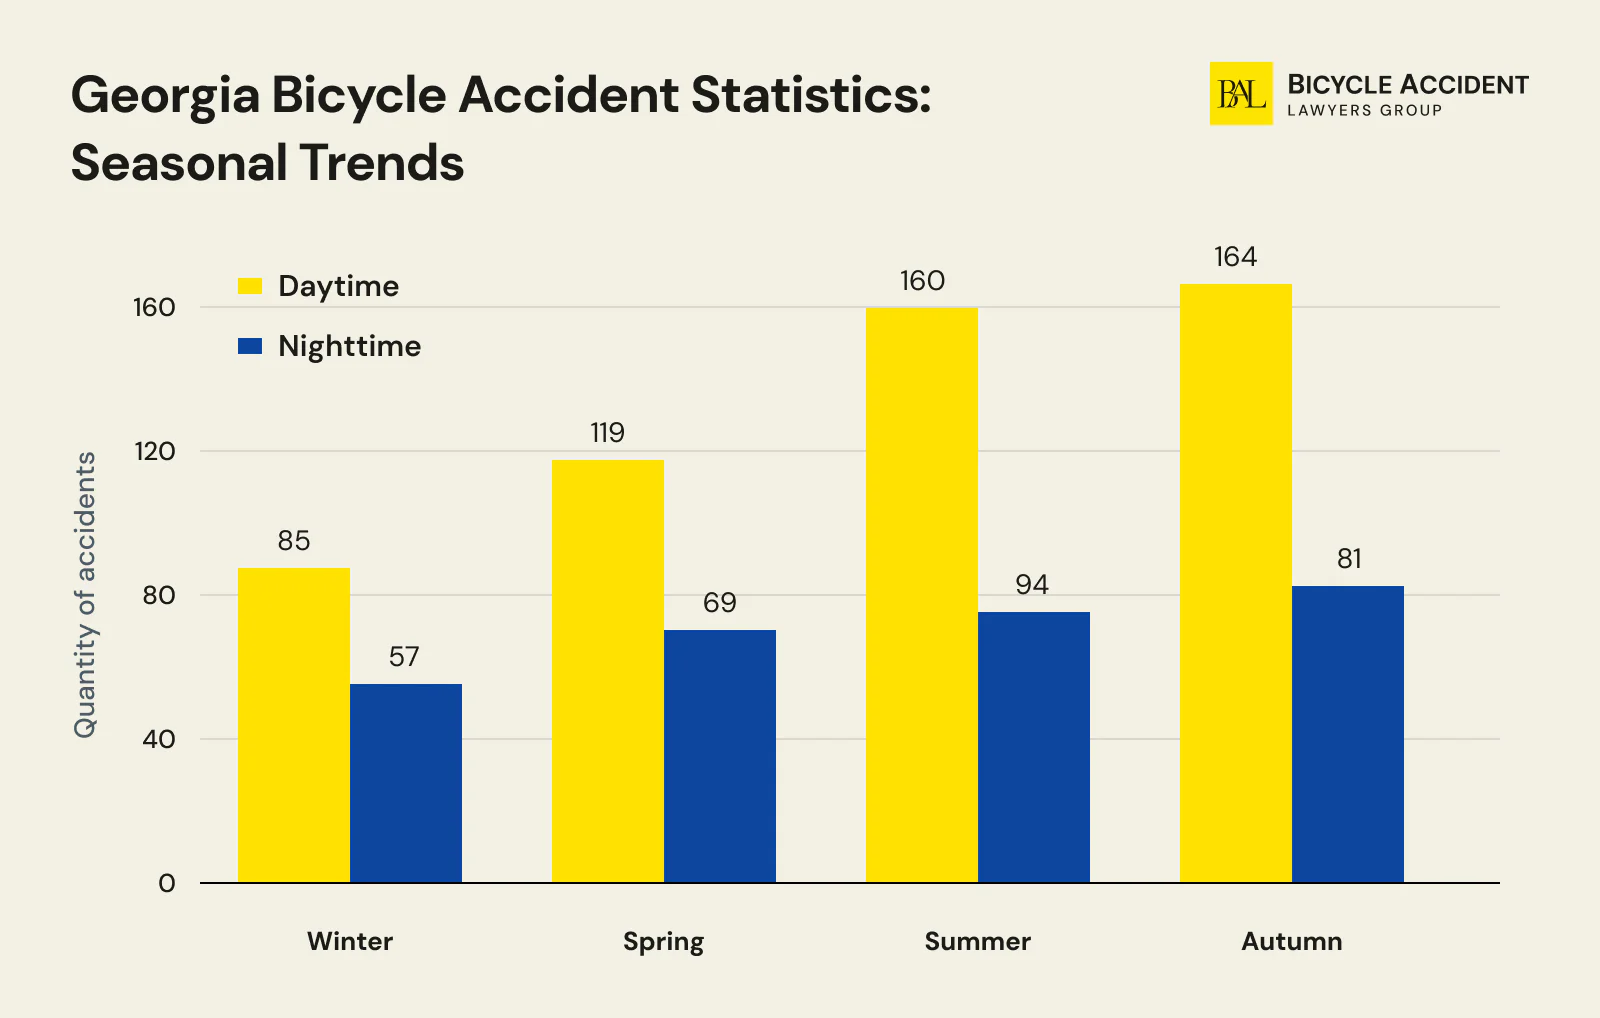
There are a few clear seasonal patterns to discuss when it comes to bicycle accidents in Georgia. Summer and fall are the busiest seasons in terms of biking incidents, together accounting for 61% of all bicycle crashes in the state. Autumn is the single deadliest season at 30% of all crashes. The most logical explanation would be that the warmer months inspire more people to hop on their bikes. Daytime crashes during this time are also prevalent, which signifies the importance of undivided attention when en route.
Although winters are relatively mild in Georgia, temperature drops as well as frequent rains force cyclists to hide away their bikes till spring. Thus, such a low biking incident rate. However, the moment spring takes over, the rate begins to increase.
| Season | Number of bicycle accidents | % |
| Winter | 142 | 17% |
| Daytime | 85 | 10% |
| Nighttime | 57 | 7% |
| Spring | 188 | 23% |
| Daytime | 119 | 14% |
| Nighttime | 69 | 8% |
| Summer | 254 | 31% |
| Daytime | 160 | 19% |
| Nighttime | 94 | 11% |
| Autumn | 265 | 30% |
| Daytime | 164 | 20% |
| Nighttime | 81 | 10% |
Georgia Bicycle Accident Statistics: Helmet Use
According to bike helmet laws in GA, all cyclists under 16 years must wear protective helmets, no matter if they are riding in a dedicated bike lane, shoulder, or highway. Georgia’s three-foot safe passing law (O.C.G.A. 40-6-294) requires drivers to maintain at least three feet of clearance when overtaking a bicycle, but no statewide helmet mandate exists for adult riders. Unlike in other jurisdictions, cyclists in Georgia comply with these traffic rules, but the statistical data shows that there’s room for improvement. Based on an in-depth analysis of bicyclists’ riding habits, we’ve managed to find out the following:
| Condition | Number of GA bicyclists | % |
| Riders injured in bicycle crashes (2022) | 830 | 100% |
| Cyclists using safety equipment | 611 | 73% |
| Bicyclists wearing protective gear | 155 out of 611 | 25% |
| Bike riders’ fatalities in 2020-2022 | 69 | 100% |
| Fatally injured riders with a helmet on | 8 | 11% |
| Fatally injured riders without a helmet | 49 | 64% |
| Fatally injured riders with unknown helmet use | 19 | 25% |
The helmet data is stark: 64% of fatally injured cyclists in Georgia were not wearing a helmet. Only 11% of those killed had a helmet on at the time of the crash. Nationally, the figures are similar, with NHTSA reporting that 62% of pedalcyclists killed were not wearing helmets. This underscores that helmet use remains one of the most actionable safety measures available to individual riders in Georgia.
Hotspots for Bicycle Crashes in Atlanta
The Atlanta Region recorded 475 bicycle crashes in 2024, 49% of Georgia’s total, and 57 of them seriously or fatally injured the rider. Fulton County alone accounted for 29 serious injuries and deaths, more than twice the next county in the state.
| Atlanta Region, 2024 | Figure |
| Bicycle crashes | 475 |
| Fatal or serious injury crashes | 57 |
| Share of those crashes that were severe | 12% |
| Bicycle crashes per 100,000 residents | 9.21 |
| Share of Georgia’s population | 46% |
| Share of Georgia’s bicycle crashes | 49% |
12% of Atlanta Region bicycle crashes produced a death or a serious injury, the lowest of the state’s 3 regions, against 17% in other urban counties and 32% in rural ones. Metro Atlanta carries the volume and the mildest outcomes.
Within the region, 33% of bicycle crashes happened on minor arterials and 31% on local roads, with principal arterials at 18%. Atlanta is the only region in Georgia where any bicycle crash was recorded on an interstate in 2024, which is rare for the reasons set out in the rules on .
Leading counties, 2024
| Measure | Leading counties, 2024 |
| Most bicyclist serious injuries and deaths | Fulton (29), Chatham (11), Cobb (9) |
| Highest rate per 100,000 residents | Morgan (9.12), Glynn (8.09), Camden (5.08) |
| Most per 1,000 motor vehicle crashes | Glynn (10.31), Chattooga (9.85), Chatham (6.84) |
Georgia vs. National Bicycle Accident Comparison
Georgia’s bicycle safety record reflects several patterns that both align with and deviate from national trends. Understanding where Georgia stands relative to the national average helps contextualize the state’s statistics and identify where the most improvement is needed.
| Metric | Georgia | National |
| Bicycle crashes (2023) | 925 | ~130,000 (est.) |
| Bicyclist fatalities (2023) | 23 | 1,166 (NHTSA) |
| Cyclists as % of all traffic deaths | ~1.4% | 2.9% |
| Decade fatality trend (2014-2023) | +283% | +87% (since 2010) |
| Urban crash share | ~85% | 86% |
| Male fatality share | ~86% | 89% |
| Fatally injured without helmet | 64% | 62% |
| Bicycle Friendly State Ranking | #23 | N/A |
| Hit-and-run share of crashes | ~25% | ~14% (national est.) |
Georgia’s 283% increase in bicycle fatalities over the past decade far outpaces the national 87% increase, suggesting that the state’s road safety improvements have been particularly slow to reach cyclists. The hit-and-run rate at 25% is also notably higher than the national average, pointing to a specific enforcement and accountability gap. On the other hand, Georgia’s lower cyclist share of total traffic fatalities (1.4% vs. 2.9% nationally) reflects that the state’s overall traffic fatality burden is driven more heavily by motor vehicle occupant deaths.
Final Thoughts on Bicycle Accident Statistics in Georgia
Georgian authorities seem to have taken a few steps to make cycling safer statewide. However, the recent accident trends prove that there’s a lot of room for improvement concerning local infrastructure, social awareness, and traffic safety ordinances.
The data outlines gaps and patterns that the municipalities should attend to. Meanwhile, if you are an avid cyclist in Georgia or plan a biking trip through the state, you must keep yourself informed on when, where, and why the most bicycle crashes take place. Moreover, you should always be legally armed after any type of bicycle accidents to protect your rights and secure fair compensation should anything happen.
Contact Bicycle Accident Lawyers Group for a free consultation to learn more!
Data Sources
The statistics in this report are drawn from the following sources:
-
Georgia Traffic Safety Facts, Pedestrians and Bicyclists, 2024 Data (2023): Primary source for 2023 statewide crash counts, county-level data, and crash location breakdowns. Data is derived from the Georgia Electronic Accident Reporting System (GEARS).
- Georgia Governor’s Office of Highway Safety (GOHS) – Source for 2022 non-motorist fact sheet data, including urban/rural breakdowns, injury severity levels, hospitalization costs, and helmet use statistics.
-
, DOT HS 813 822, National Highway Traffic Safety Administration, July 2026. Used for every national figure and for the state-by-state comparison.
Some sections use 2022 data (urban/rural, injury severity, helmet use) from the GOHS fact sheet, while others use 2023 data from the Georgia Bikes crash database. Where the data year differs, it is noted in the relevant section.
Share the details of your situation with us so we can begin advocating on your behalf. We customize our approach to fit the unique needs of each client.


Robert Goldwater is a cyclist representing cyclists. He has practiced personal injury and wrongful death law for more than 20 years, graduating with Honors from Arizona State University Law School, and has helped recover over $1 billion for clients, including injured cyclists.